Sunday Musings: Deflation And Double Dip Recession

Ulli Uncategorized Contact

Reader Rick emailed the following question:

I have been reading several blogs and newsletters that are stating that the US may be looking at a Double Dip recession later this year but even more so in 2011. What is your take on this possibility?

Also, I am seeing more and more mention of deflation without much being said about where to position a portfolio or what to invest in if deflation does hit. Would you please comment on a deflationary scenario?

Yes, I think a slide back into a recession is a distinct possibility. Actually, we might be still in one had it not been for the reckless spending of trillions of stimulus dollars. Since we are on the back side of busted real estate/credit bubble, we are a bit in unchartered territory, the exact outcome of which is still an unknown.

There is no way to anticipate what will happen and what your future portfolio should look like. The beauty of trend tracking is that we don’t have to guess. We first determine where the major trend is at. Right now, domestically, we’re still dancing above/below the long-term trend line by a small percentage with a potential break below it lurking in the near future.

Once that happens, we will have to evaluate which areas are still showing increasing momentum figures as featured in my weekly StatSheet. Then we can determine if any sectors have merit or if outright short investments via ETFs like SH or SDS are sensible.

Trying to establish positions now or making major portfolio changes in anticipation of deflation or double dip recession makes no sense to me. As always, my recommendation is to wait and let market show us the way.

Looking at the big picture, if you were to divide the investment world into 5 major asset classes, you might come up with the following:

Bonds (+1.95%)
U.S. Stocks (-7.95%)
Foreign Stocks (-9.26%)
Commodities (-9.56%)
Real Estate (-0.66%)

All of these 5 are well represented in the ETF world and can be bought at anytime. The numbers in parentheses (as of 7/2/10) represent the percentage each asset class is positioned above or below its respective long-term trend line indicating whether it is in bullish or bearish territory.

All are in bear market territory with the exception of bonds. That pretty much tells you the current state of affairs as to where the major trends are headed. Given that fact, I think trying to outguess market direction and attempt to position a portfolio at this time is like trying to catch a falling knife.

Stay in those areas where the momentum is, which currently is in bonds and selectively on the short side of the market until directional changes become apparent.

Patience is crucial as we may be slipping into an economic environment for which there has been no precedent.

Deadly Bottom Fishing

Ulli Uncategorized Contact

Some readers like to look at fundamentals as a primary decision tool to add a position to their portfolio. Just because fundamental data seem to paint a rosy picture about a certain sector being ready to explode, does not mean that I will.

Never ever have the famous words “it can’t go any lower” rung truer as in the case of natural gas. Over the past few months, I have received several emails about the imminent turnaround in that arena and how great of an opportunity current pricing would be.

One look at a 2-year chart of UNG (courtesy of YahooFinance) tells you the real story:

It represents a sector stuck deeply in a downward trend since about August of 2008, when the trend line was broken to the downside. This is about as graphic as you can get as to why bottom fishing can be hazardous to your financial health.

It supports my view that a simple chart can quickly demonstrate where a sector is headed, while fundamentals will never show you as clear a picture.

Sure, eventually UNG will turn around and present a great buying opportunity. However, you want to first see a clear change in form of the trend line being broken to the upside. While this may take some time to accomplish, it will always be accompanied by improved momentum figures as featured in my weekly StatSheet.

While you can get lucky going bottom fishing, a better mode of operation is to put the odds of a successful investment on your side first. That means not trying to hunt for the lowest price but let upward momentum be your guide as to when to enter.

Disclosure: No positions in UNG

No Load Fund/ETF Tracker updated through 7/1/2010

Ulli Uncategorized Contact

My latest No Load Fund/ETF Tracker has been posted at:

http://www.successful-investment.com/newsletter-archive.php

The bears ruled, and the major indexes lost 5-7% for the week .

Our Trend Tracking Index (TTI) for domestic funds/ETFs barely slipped below its trend line (red) by -0.40% (last week +1.19%). For more on how to handle this, please see the above link.

The international index has now broken below its long-term trend line by -4.49% (last week -1.84%). A Sell Signal was triggered effective May 7, 2010. We are no longer holding any positions in that arena.

[Click on charts to enlarge]

For more details, and the latest market commentary, as well as the updated No load Fund/ETF StatSheet, please see the above link.

Peeking Into Bear Market Territory

Ulli Uncategorized Contact

Today’s slightly lower close finally pushed our domestic Trend Tracking Index (TTI) below its long term trend line, although only by a fraction of a percentage. We slipped below the dividing line between bullish and bearish territory by a minuscule -0.06%.

That is not enough to declare a defeat of the bulls by the bears. As I posted this morning, I like to see a clear piercing (around 1%) followed by couple of trading days holding the level below the line. This will enhance our chances of avoiding an immediate whipsaw signal.

Once that has occurred, and tomorrow’s jobs report might get us there in a hurry, I will declare this buy cycle as being over. Stay tuned.

Still Hovering “Above” The Trend Line—By The Slightest Of Margins

Ulli Uncategorized Contact


When I watched the major indexes sink into the close yesterday, I was certain that the Domestic Trend Tracking Index (TTI) had finally crossed into bear market territory.

When the final numbers were computed, we had come close but the TTI did not actually cross below the line. Here are the latest figures:

Domestic TTI value: 44.36
39-week trend line: 44.34
% above/below the line: +0.04%

The 39-week trend line will be recomputed again on Friday, so, if the markets meander around current levels, we might see a break at that time. If more downside action comes into play today, we could see a move into bear market territory later on.

Again, I like to see a clear piercing of the trend line to the downside, followed by a couple of trading days holding the level below, before accepting it as major trend change from bullish to bearish.

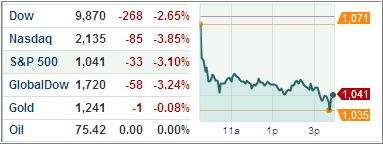
A potential downgrade of Spain’s credit by Moody’s sent the markets lower with the S&P; 500 breaking through the critical 1,040 support level as I discussed in yesterday’s post. Besides violating the support, the major indexes are all sporting clear head and shoulders formations, which are one of the most reliable trading patterns when it comes to directional change.

Any more bad news, especially from Friday’s jobs report, will send the indexes to much lower levels. Of course, given the amount of selling lately, there is bound to be a bounce of some sort, which will very likely to turn out to be another head fake.

If it should materialize, I would expect it to happen after the 4th of July holiday, since many traders may not want to be caught with outright long positions during these uncertain economic times over an extended weekend.

Descending Towards Bear Market Territory

Ulli Uncategorized Contact

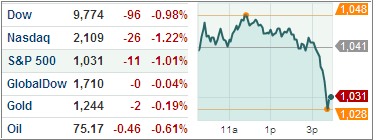
Right out of the gate, the markets hit the skids yesterday, as the above chart clearly shows.

One supporting actors in this drama causing this sharp selloff was a disappointing report on the Chinese economy as their leading indicators were downwardly revised. Adding fuel to the fire was a drop in the consumer sentiment index to the lowest level since March.

Despite a rise in U.S. home prices and a three-month extension of the home buyer tax credits, the markets were solidly entrenched in a downward move and never looked back.

Technically speaking, the S&P; 500 dropped intra-day below its strong support level of 1,040 (see chart above) but managed to close above it. If this level gets broken, you may see downside activity gain momentum.

The selloff was not enough to push our Domestic Trend Tracking Index (TTI) into bear market territory, but we are within striking distance—again. As of yesterday’s close, the TTI has moved to with +0.35% of breaking its trend line.

Any follow through selling, which is likely to happen, especially if the 1,040 level of the S&P; is violated, will end this domestic buy cycle and change our investment stance from bullish to bearish. Since you may use this break as your final exit point, I will post this event, as soon as it happens, based on the closing prices of the day.

Wall Street traders’ anxiety may very well increase somewhat over the next couple of days not only in view of yesterday’s drubbing but also because of the impending jobs report on Friday.

More uncertainty about the economy will derail this market further and life below the S&P;’s 1,040 level may very well be financially hazardous for those hanging on to outright long equity positions.