Stadion Funds Responds

Ulli Uncategorized Contact

Several readers sent in positive responses regarding my post on Stadion’s ETFFX fund, which uses some form of trend tracking to avoid market exposure during bear market drops.

Stadion’s Senior VP Steve Beard had this to say:

Your recent writing in which you commented favorably about Stadion’s approach to managing money was gratifying. Thank you. Two things: ETFFX has actually been around a year longer than mentioned (since Sept. 2006), and we now offer an institutional share class without load or 12b-1, which brings the expenses down to just over 1.5%.

Added notes: Stadion has employed its money management model since January 1996. ETFFX is cloned from our longstanding SMA model, which has produced the same type of results but over a much longer period of time. In the ‘yardstick’ years of 2000, 2001, 2002, Stadion actually produced positive returns each year, not just over the 3 year period but in EACH of the 3 years (+12, +1, + a fraction).

And you are entirely accurate in saying that investors don’t need giant returns following bad markets if they haven’t suffered giant losses during the bad markets. In the ‘lost decade’ we delivered about 7% per year gain to our investors despite having no particularly remarkable ‘up’ years. As managers, we believe the emphasis should be on performance OVER time versus any given year IN time. We enjoy telling advisors and clients that while we may not be the prettiest girl at the dance (in any given year), we may be the one you want to marry.

I agree with his statement that performance should be judged over time and not just for a short recent period. More importantly, it should always include a period of bullishness and bearishness so that any shortcomings of an investment approach are clearly visible.

However, that is not standard operating procedure. For example, the bear market of 2000/2001 ended early in 2003. I remember reading many main stream media articles in 2006 and thereafter that referred to the fact that mutual fund performance references were about to improve as the ugly 3-year numbers were finally dropping off the records.

In other words, Wall Street likes to measure and publicize only returns for bull market periods. 5 years after a bear market ends, the records are “clean” again and unsuspecting investors will make the same mistake by judging only what’s in front of them (a bull market) and not considering the consequences once the bear returns.

I can only hope that this attitude has finally changed as 2 bear markets in the past decade should have sent a loud and clear message.

Sunday Musings: Market Tops

Ulli Uncategorized Contact

Currently, a clear long-term trend can’t be found anywhere among the major indexes. If you look at charts of the Dow Industrials, Transportations, Nasdaq, S&P; 500 and others, they’re all in the process of forming large tops, which can have dire downside consequences, unless a breakout to the upside occurs.

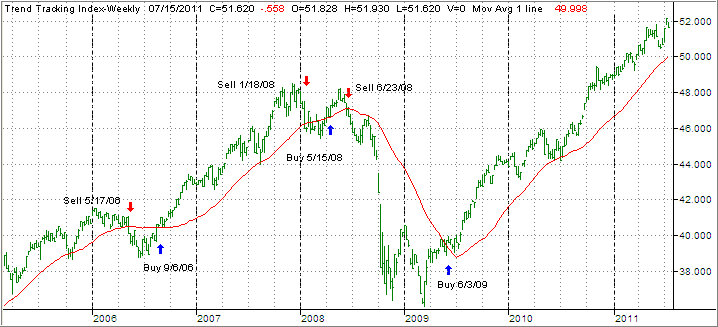
Very typical of representing a market top is our Domestic Trend Tracking index (TTI). Take a look at this multi-year chart:


[Double click chart to enlarge]

It’s apparent that the current topping formation is very similar to the one we’ve seen in 2008, although smaller in size. While the markets can churn sideways for a while longer, eventually, there are only two likely outcomes:

1. The markets will gather enough momentum and continue to rally by taking out the old high of 46.00, which means this topping formation from a technical point has been erased, or

2. Upward momentum deteriorates, prices sink and eventually a break to the downside occurs (through the red line), which puts us clearly back into bear market territory.

For most of this year, we have spent chasing the markets up from the 44 level in the above TTI to a high of 46, then back down and now back up. The more widely followed S&P; 500 confirms this pattern as well as it remains in negative territory YTD.

As I have posted, it’s been one large sideways movement, which has proved to be frustrating for investors and advisors alike, no matter what your methodology has been.

Be aware that this type of market sloppiness is a sign of great uncertainty, as far as market direction is concerned, as opposing forces pretty much have cancelled each other out in a typical bull vs. bear tug-of-war.

This time will come to an end for sure; we just don’t know exactly the timing of it. When it does, you will recognize that a new trend has been set as pointed out above. Just be aware that it may not be in the direction you had hoped for, so remain prepared to deal with a bearish outcome if that is what the future has in store for us.

Reader Feedback on ETFFX

Ulli Uncategorized Contact

Several readers emailed comments regarding last Saturday’s post covering ETFFX. Here’s what Glenn had to say:

It looks like they are using something similar to a 60 day SMA of SPY to make decisions. Sometimes they apparently are not 100% ‘in’ though, resulting in underperformance in an up market. And looks like they occasionally use some other criteria, or don’t follow the plan and underperform too, e.g., early November-mid-December 09.

Still, they more or less equaled SPY performance from 10/06 (apparently before it was available for purchase) to end of 07, out-performed by a large margin during the downturn, and then under-performed during the bull starting in March 09.

Thanks for passing this along. It may be a worth a try for some passive investing.

While I don’t know what methodology they use, it’s important to note that they did avoid the brunt of the 2008 crash, which is what really matters. Here’s the chart again comparing ETFFX vs. the S&P; 500 vs. the total bond market index:

Let’s assume for a moment that ETFFX is somewhat representative of what trend tracking is all about. It will smooth out the investment ride for you by limiting (not avoiding) losses by being on the sidelines when bear markets strike. Because it is a defensive way of investing, you will lag during bullish periods because of the effect of sell stops during pullbacks and the incremental move back into the markets.

If you are looking for outperformance during bullish periods, you will very likely not see it. Given that, how do you then outperform the S&P; 500? Very simple; only by combining the returns during bullish AND bearish phases in the market will you come out ahead.

Here’s an interesting anecdote. A reader called me at the end of 2009 and shared with me the following story: He had been with an advisor who grew this portfolio at a rate of 35% per year for 3 years straight.

Upon my inquiry as to why he was calling me, since I don’t generate those kinds of returns, he hesitantly replied “well, in the fourth year, I lost 80%.”

If you put a calculator to these numbers, you will conclude that, despite 3 years of incredible returns, he ended up losing half of his original investment. Now he has to make 100% on the balance just to get back to a breakeven point.

The moral of the story is that profits are meaningless, unless you have a way to protect them when sentiment changes from bullish to bearish.

No Load Fund/ETF Tracker updated through 7/29/2010

Ulli Uncategorized Contact

My latest No Load Fund/ETF Tracker has been posted at:

http://www.successful-investment.com/newsletter-archive.php

Sideways meandering left the major indexes almost unchanged from last week, but up for the month of July.

Our Trend Tracking Index (TTI) for domestic funds/ETFs held above its trend line (red) by +2.50% (last week +2.62%) and remains in bullish mode.

The international index has now broken above its long-term trend line by +1.32% (last week +1.16%). A new Buy Signal was triggered 7/23/10 with the effective date being 7/26/10. Be sure to use my recommended 7% trailing sell stop discipline should you decide to participate in this new uptrend.

[Click on charts to enlarge]

For more details, and the latest market commentary, as well as the updated No Load Fund/ETF Tracker StatSheet, please see the above link.

Dancing Around The Trend Line

Ulli Uncategorized Contact

The battle of earnings vs. economic data continued yesterday as the markets declined slightly but essentially went nowhere.

The Fed’s beige book simply repeated what Fed chairman Bernanke already elaborated on over the past couple of weeks that the economy has lost some steam with not much hiring going on in addition to continued sluggish real estate markets.

As far as upward market momentum is concerned, we have stalled. The S&P; 500 has been dancing around its widely watched 200-day moving average (currently at 1,114) but has not made any meaningful advances above it.

Technically speaking, we have been range bound, and a positive piece of economic news is needed to push us onto higher ground. In the absence of such support the path of least resistance will be to the downside.

The question is wide open at this point as to whether the 1,114 level will continue to serve as resistance, and the top of the rally, or become a new consolidation point to function as a springboard for more gains.

Because if this uncertainty, I have not yet removed the short component of our hedge nor have I added any new positions based on the recent international buy signal. Avoiding a potential whipsaw is important during this sideways period, and I’d rather be a little late to the party than too early.

Maybe the reports on weekly jobless claims and U.S. economic growth due out later this week will give some clue as to which direction the major trend will take.

Taking A Breather

Ulli Uncategorized Contact


After the recent run, the markets took a breather yesterday with the S&P; 500 resting right on its 200-day moving average of 1,114. Attempts of breaking above that level proved to be ephemeral in nature as the 1,121 level was only touched and sideways movements prevailed for the remainder of the session.

Not helping matters was a gloomy report on consumer confidence with the index hitting its lowest level in five months. That should come as no surprise as the jobless rate is anticipated to hover around the 10% level for the foreseeable future.

Last time I checked money for consumer spending and home purchases is usually derived from earned income via a job. In the absence of any improvement in that arena, prospects for a solid recovery remain a mirage.

Be that as it may, the indexes did not sell off yet after the recent run up, which could be considered a bullish sign. However, it remains to be seen if the failing faith in the economic recovery will eventually be noticed by Wall Street and play itself out via a trend reversal.

While I believe the odds of this happening are great, right now I will treat this up move with great respect (with only limited additional exposure) knowing that through my lens the fundamentals simply do not justify these lofty levels.