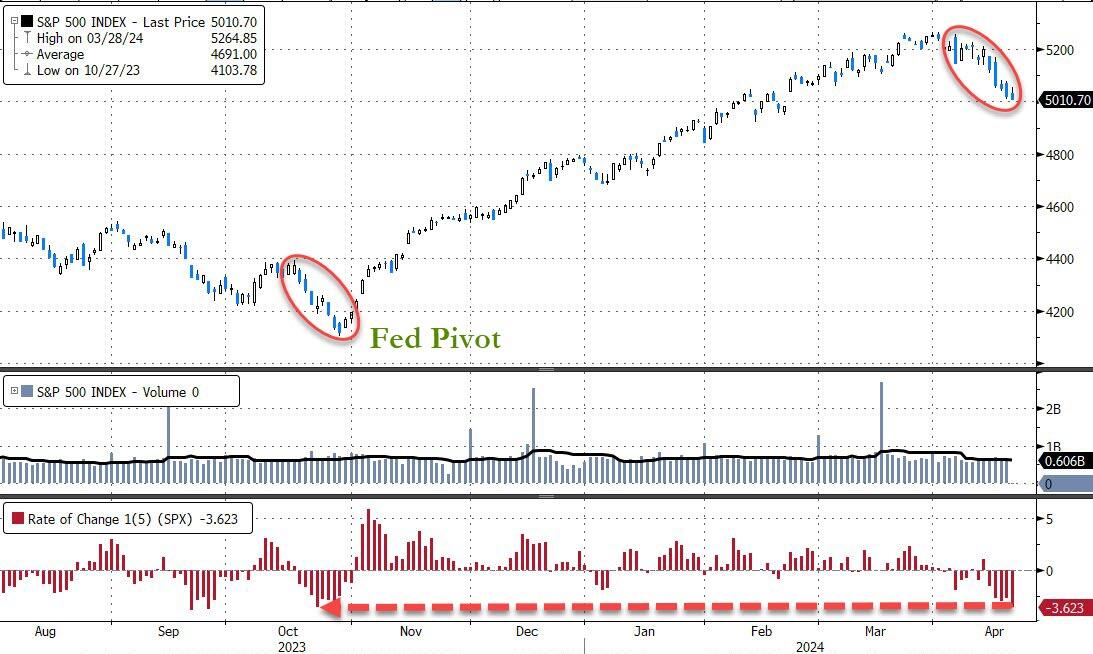
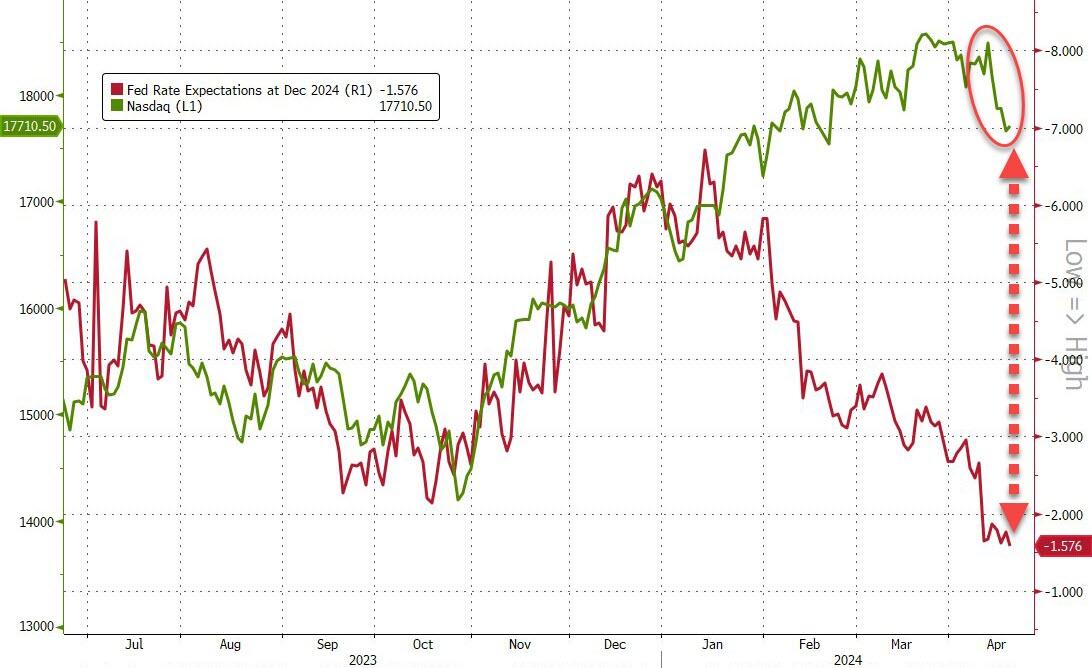
The S&P 500 index continued its downward trajectory, extending its losing streak to five consecutive days. Wall Street witnessed a seesaw battle between optimism and caution, resulting in a lackluster recovery attempt. Meanwhile, the Nasdaq faced headwinds, struggling with a 3% decline this week, marking its longest negative streak since December 2022.
Amidst this volatility, more than 12% of S&P 500-listed companies have reported earnings, showing promise for a positive season. Notably, 73% of these companies have exceeded Wall Street expectations. However, the second quarter has proven challenging due to mounting concerns about inflation and the Federal Reserve’s monetary policy.
As April unfolds, all three major indexes remain in the red, a stark contrast to the robust performance seen in the first quarter.
Bond yields surged, impacting equities, while Bitcoin and gold exhibit contrasting trends. The critical question remains:
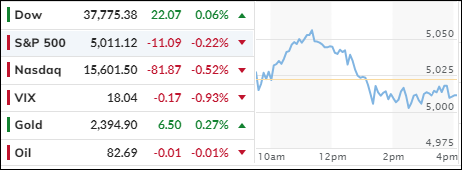
The S&P 500 extended its losing streak, dropping for a fourth consecutive session. Struggling technology stocks, including Nvidia, exerted downward pressure on the market. Interestingly, this is the third straight session where stocks opened higher but then faded throughout the day.
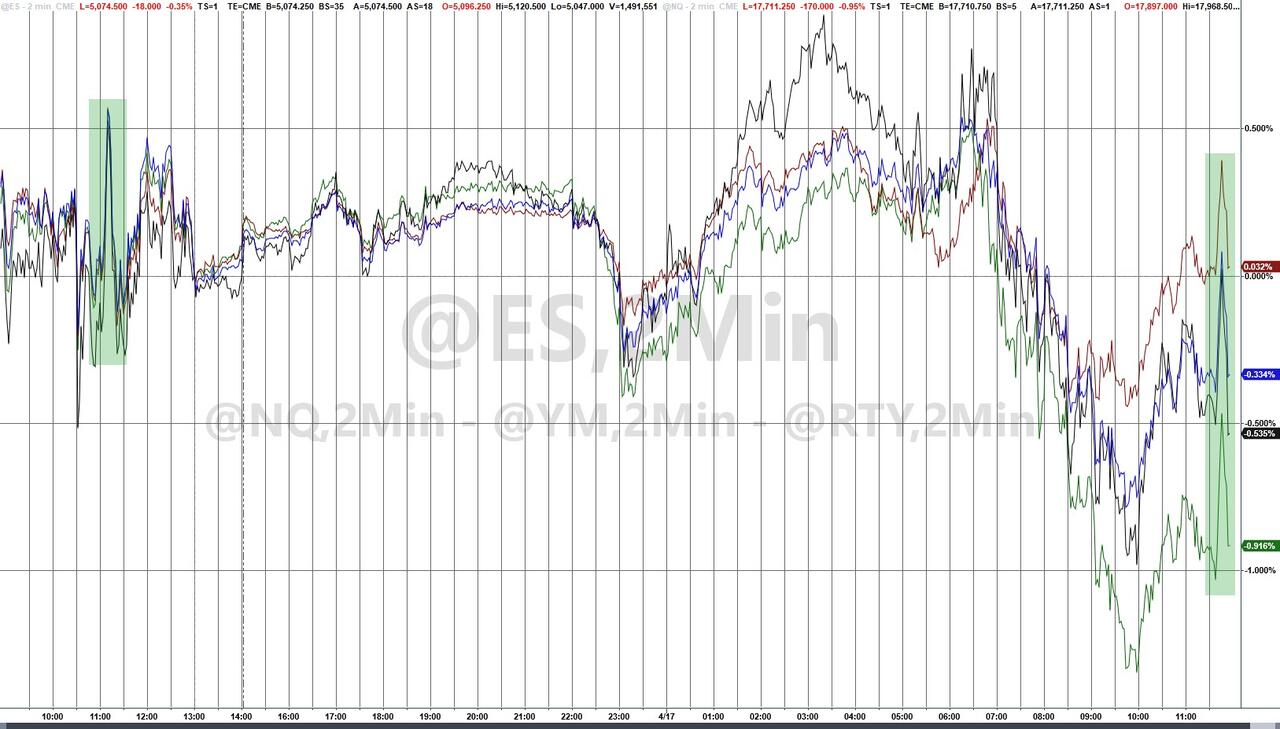
Early in the trading day, stocks were sliding after the opening. However, around 10:55 AM ET, a headline about STRIKING IRAN’S NUCLEAR FACILITIES caught investors’ attention and led to an aggressive decline in stock prices.
Despite the recent volatility, the earnings season has kicked off on a promising note. While less than 10% of S&P 500-listed companies have reported financial results so far, more than three out of every four have exceeded Wall Street expectations.
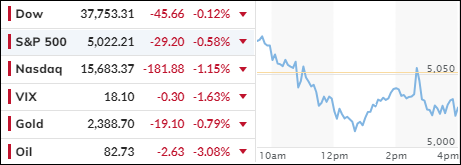
The Dow managed to break its six-day losing streak thanks to UnitedHealth’s post-earnings rally. However, both the S&P 500 and the Nasdaq Composite experienced three consecutive days of declines.
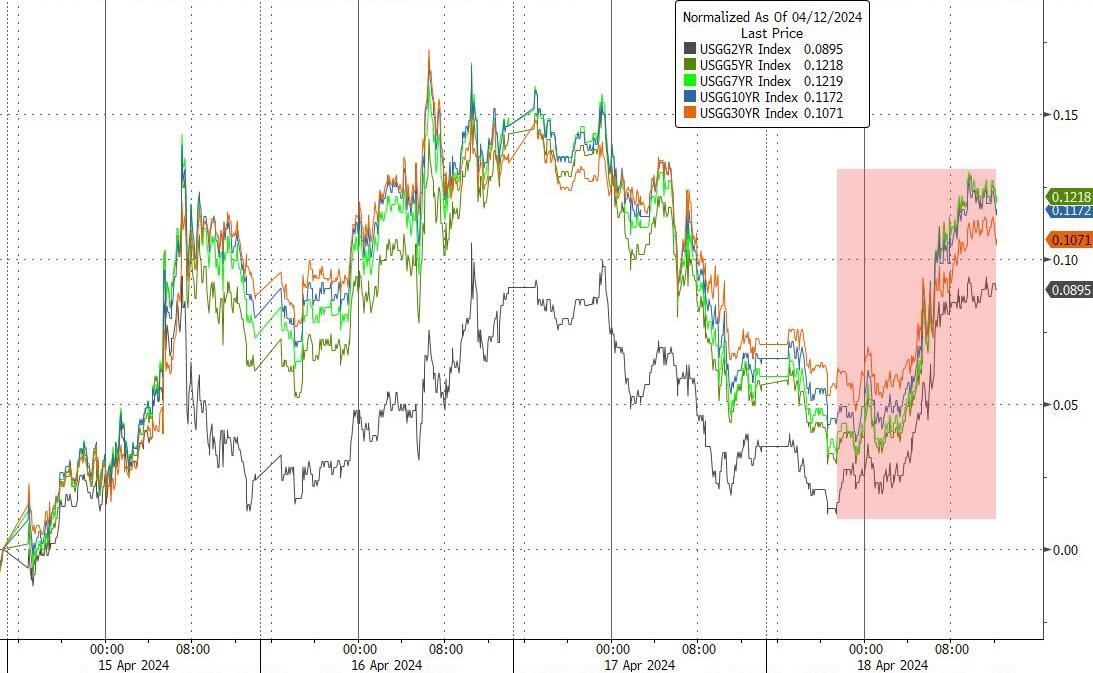
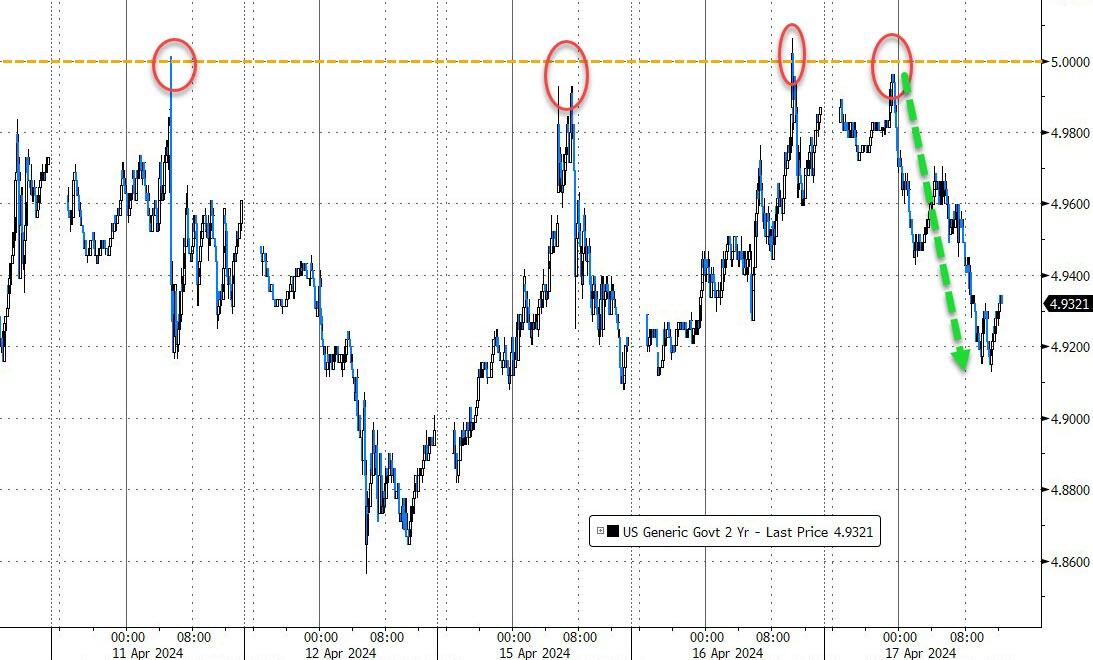
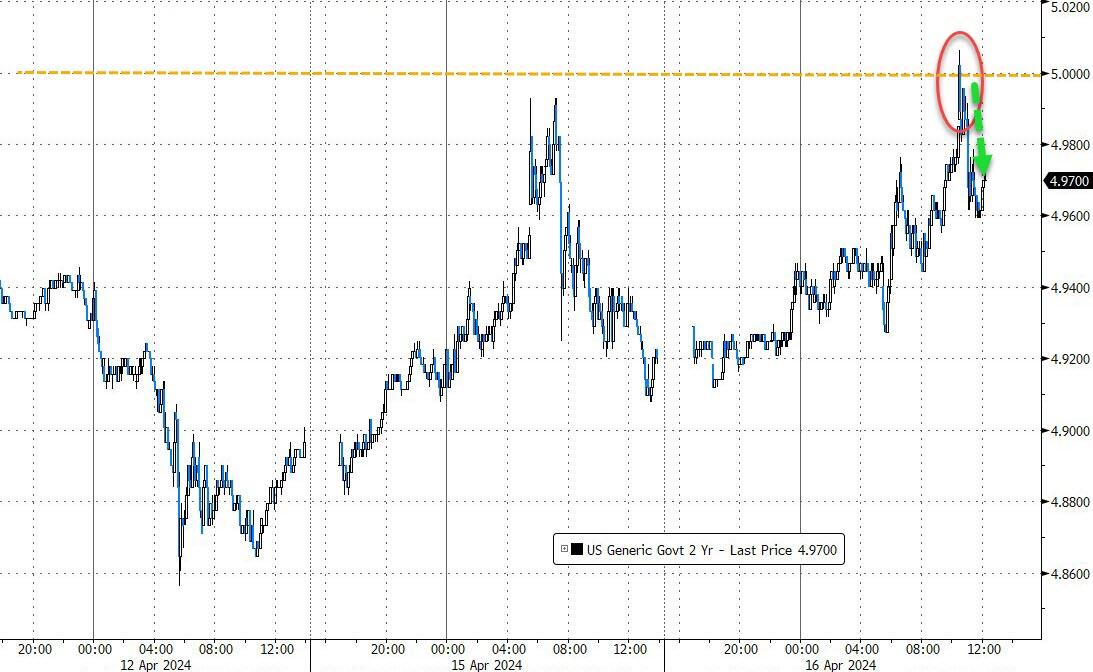
On Tuesday, Federal Reserve Chair Jerome Powell emphasized that the central bank needs to see further progress on the inflation front before considering rate cuts. Meanwhile, the U.S. 2-year Treasury yield remained relatively stable after briefly crossing the 5% mark following Powell’s remarks.
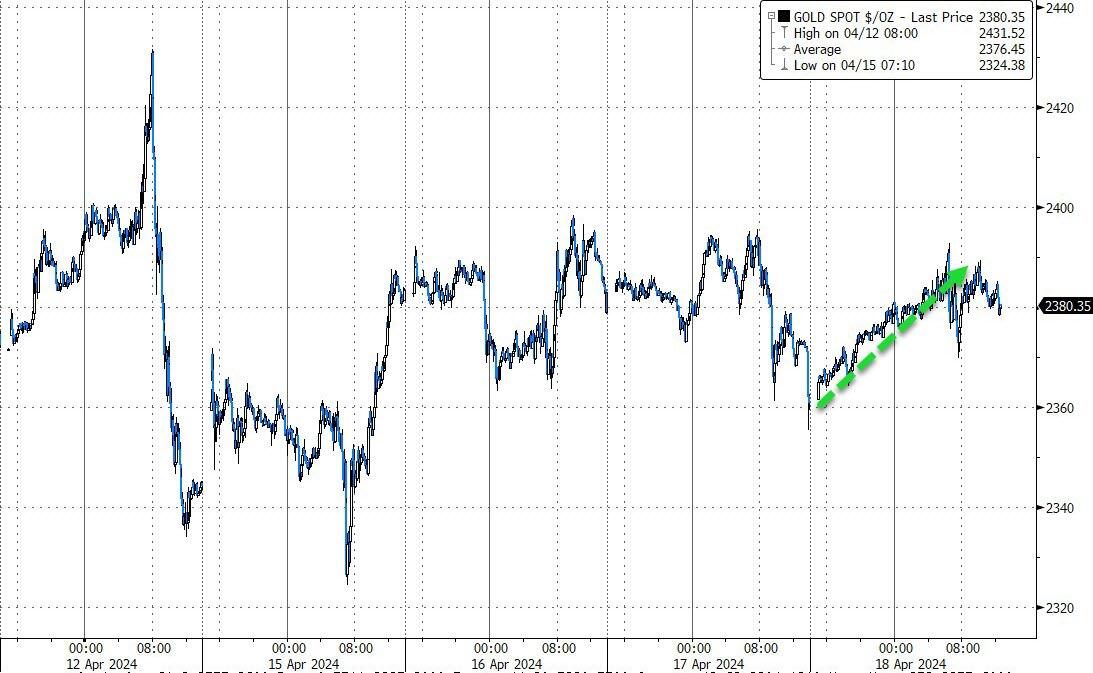
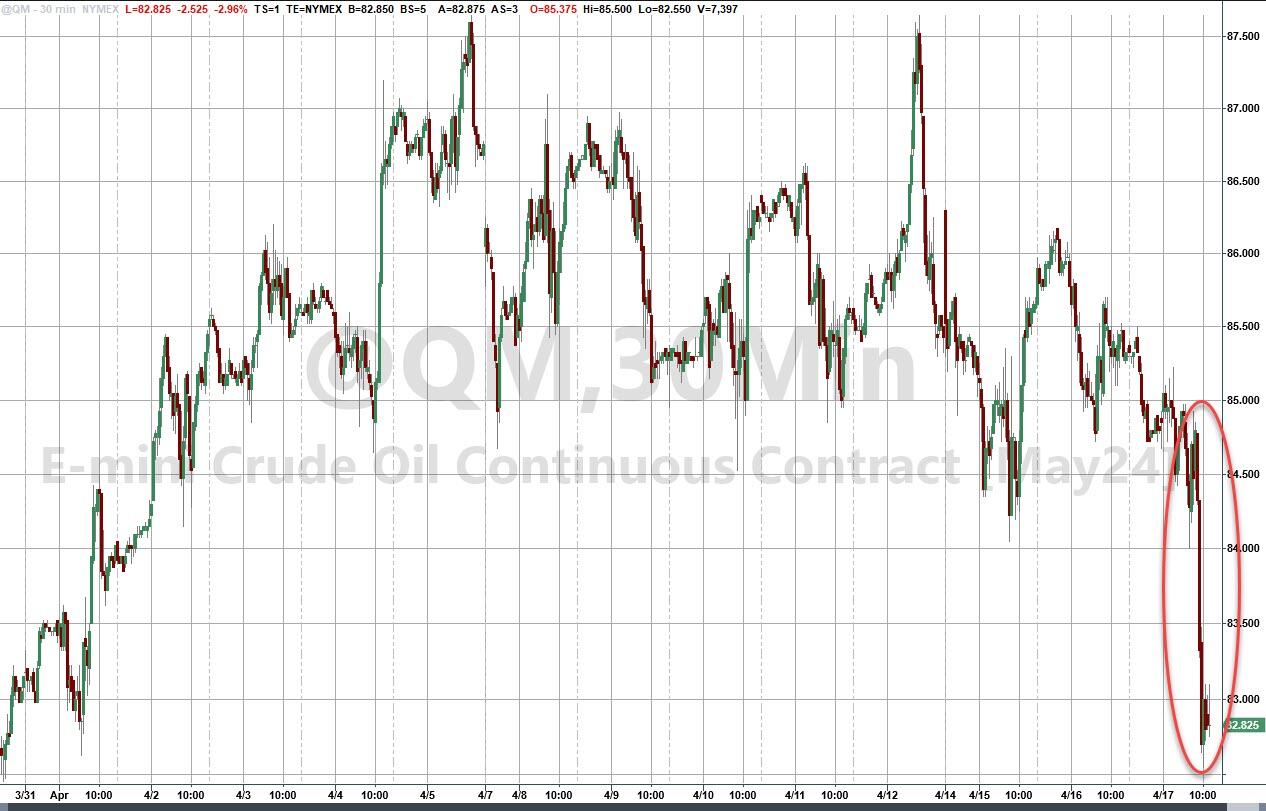
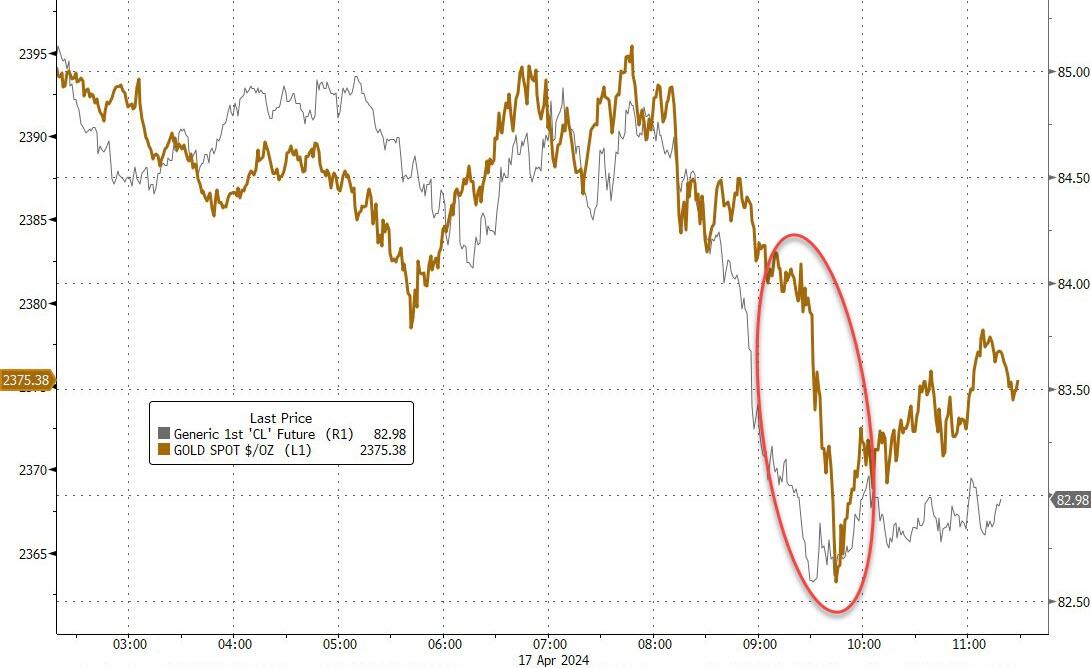
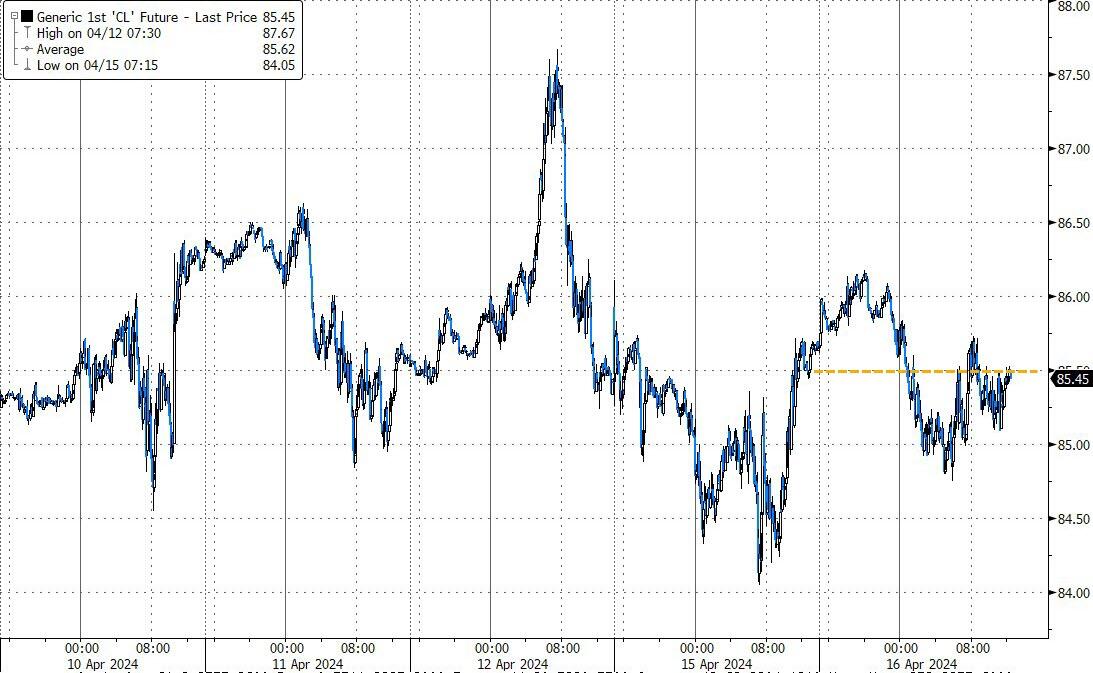
In the commodities market, crude oil initially drifted lower due to a larger stockpile build, but then Venezuela’s Maduro and SPR headlines caused a sharp price drop to three-week lows. Gold also tumbled, resulting in a losing session.
The trading session took an unexpected turn at 2 PM ET, with stocks going vertical for no apparent reason, only to reverse just as quickly—an almost perfect repeat of the previous day’s pattern.
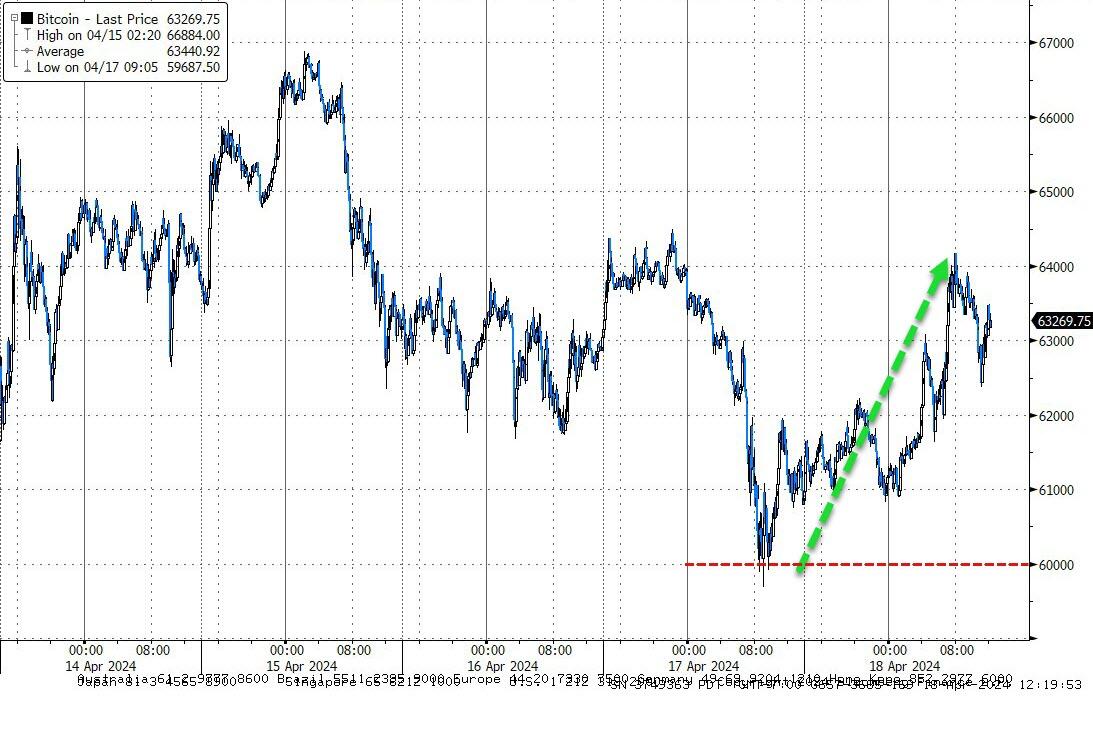
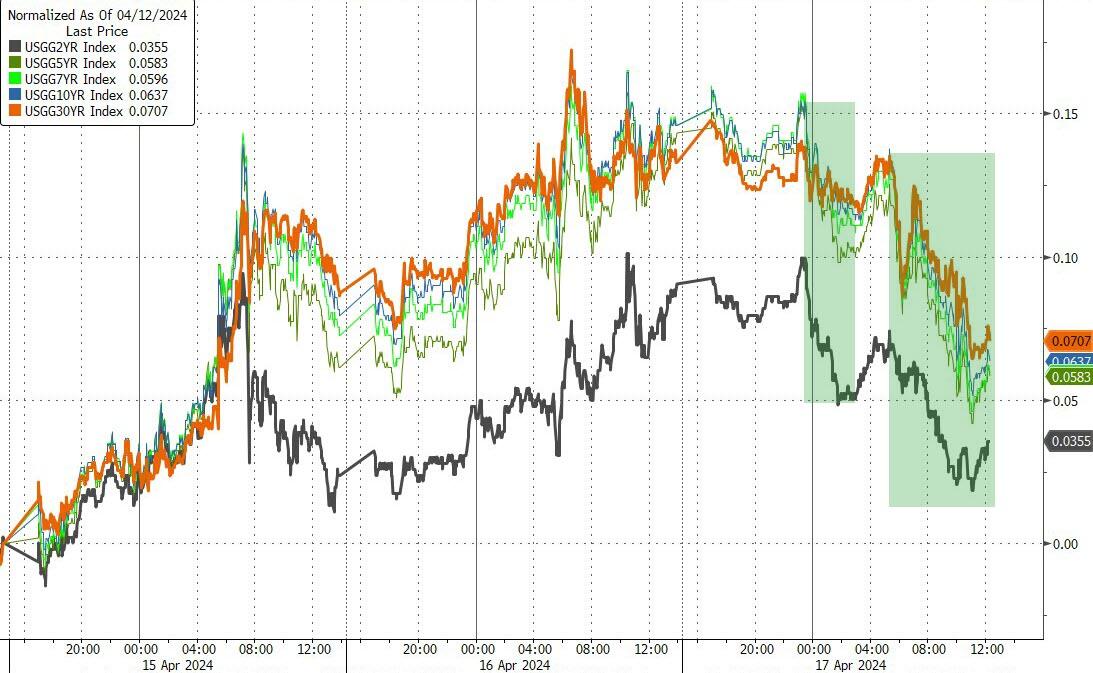
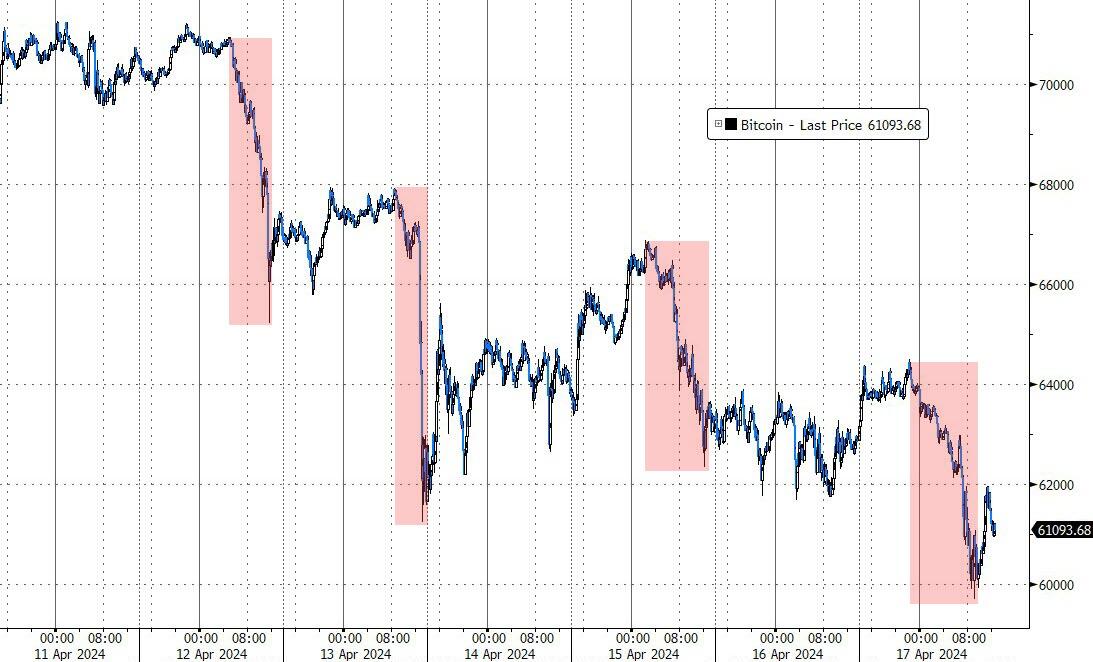
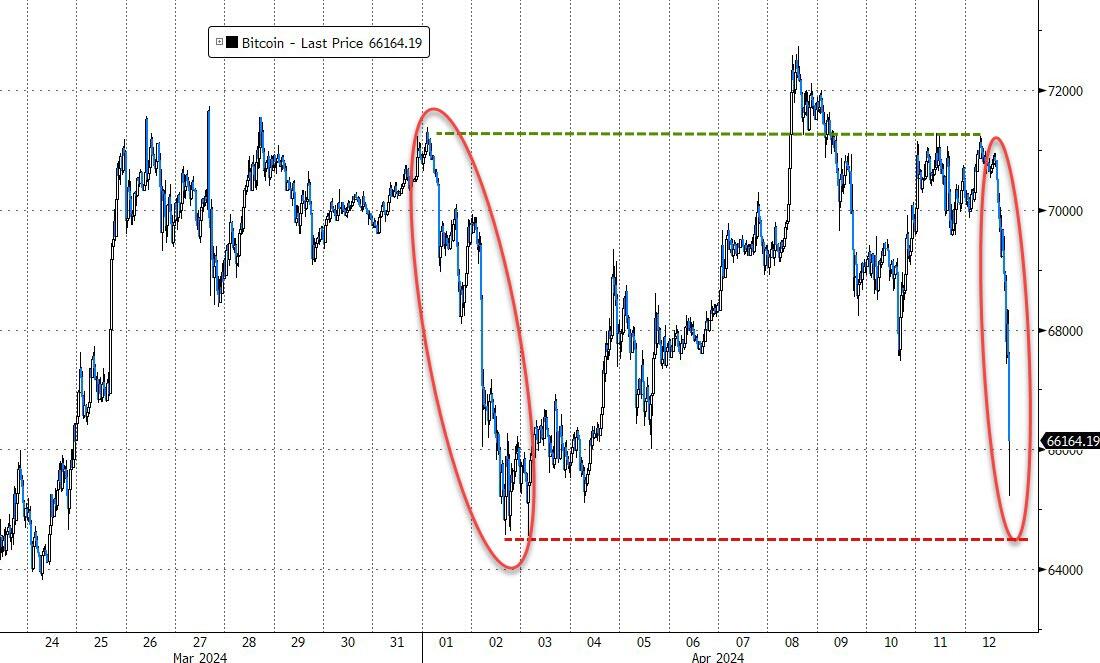
Bond yields finally fell, providing some relief to bond holders. The 2-year yield rejected the 5% level, and rate-cut expectations remained unchanged. Additionally, the U.S. dollar declined for the first time in six days, while Bitcoin found support around the $60,000 level.
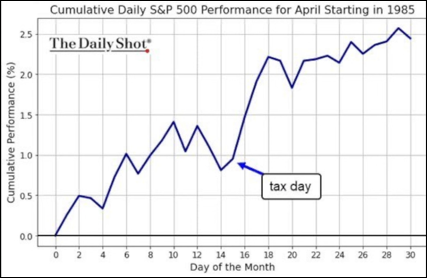
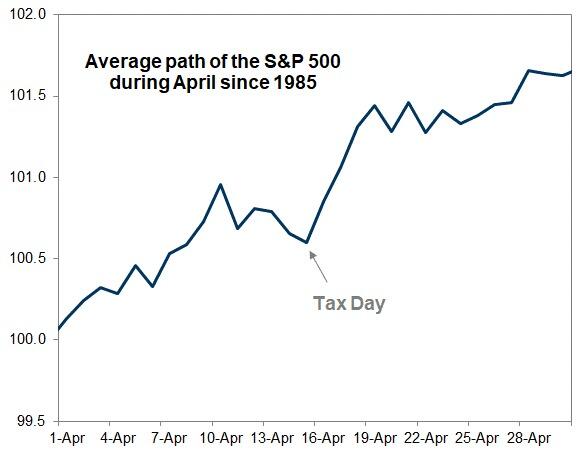
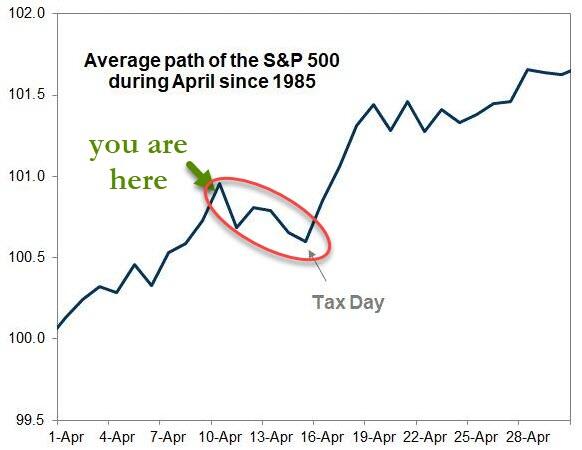
So far, the S&P’s historical 2nd half April performance has not come into play yet:
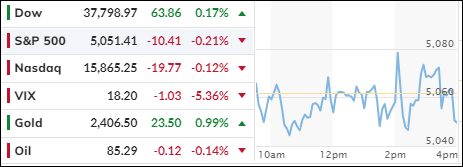
In today’s financial landscape, the S&P 500 experienced a downturn as investors juggled the latest corporate earnings with rising yield concerns and geopolitical tensions.
Federal Reserve Chair Powell’s remarks suggested that interest rates might remain high, dampening hopes for rate cuts and driving the 2-year yield above 5% for the first time since last November.
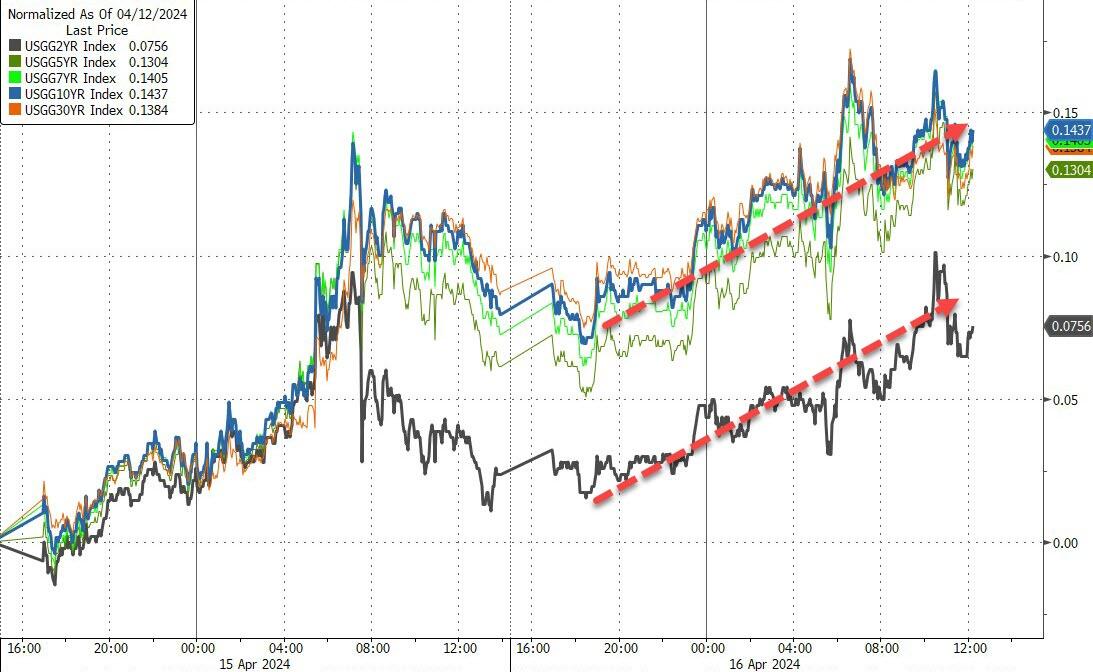
Despite the uncertainty, there’s a silver lining: most of the S&P 500 companies that have reported earnings so far have surpassed expectations, offering a glimmer of optimism. However, the persistence of higher interest rates has cast a shadow over this positive trend, with the 10-year U.S. Treasury yield soaring past the significant 4.6% threshold.
Globally, the market’s pulse quickened with news of Iran’s missile and drone strikes on Israel, contributing to a cautious sentiment. This unease was mirrored in the bond market, where yields surged, leading to a tumultuous day that saw the S&P 500 and Nasdaq close in the red.
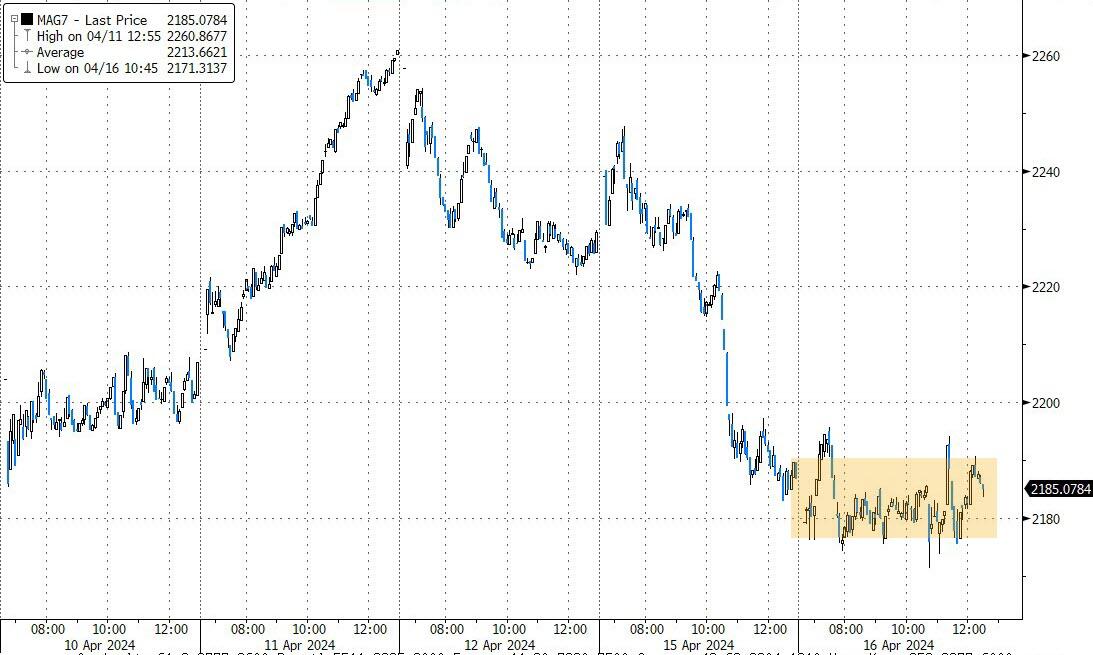
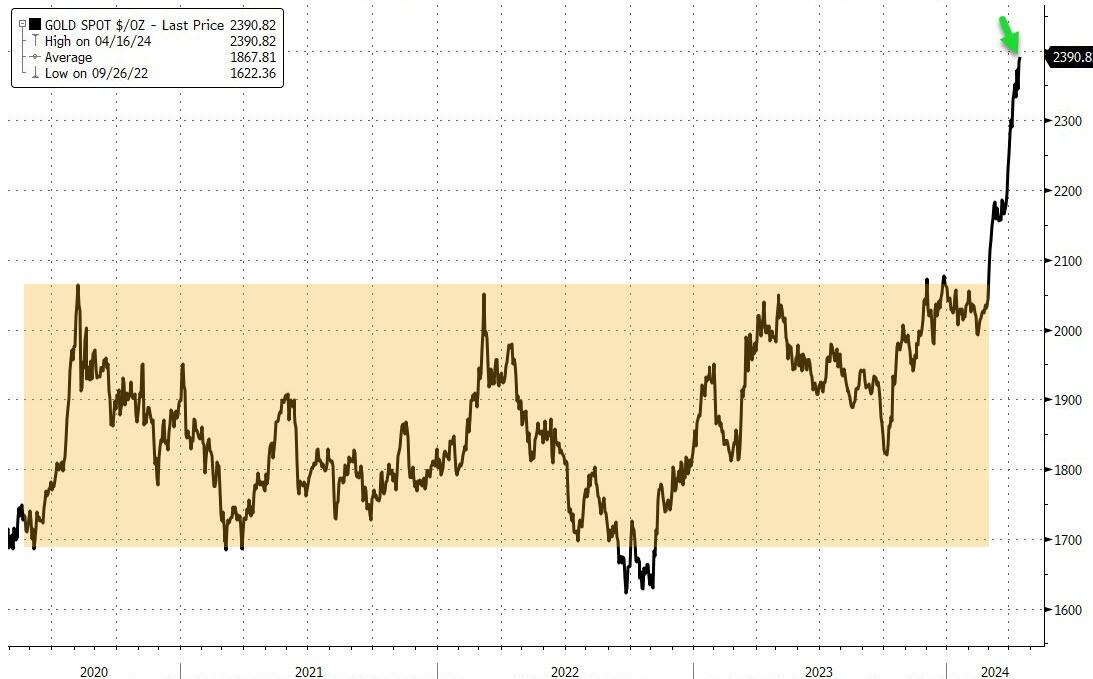
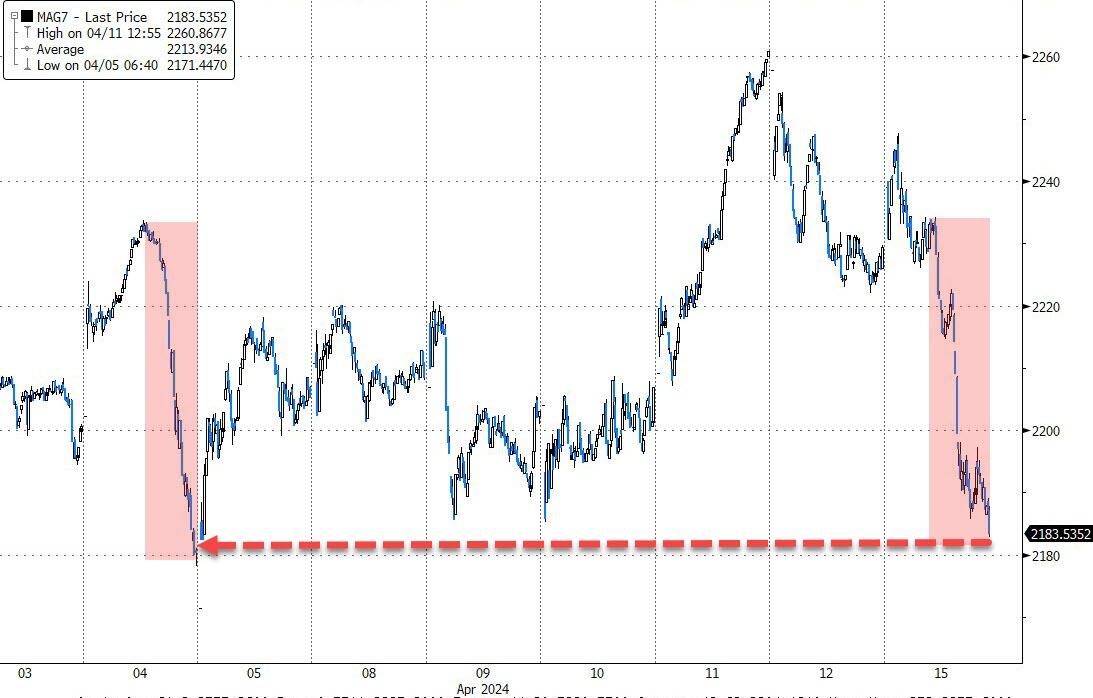
Amidst this, the MAG7 stocks remained steady, the dollar saw modest gains, while crude oil prices held steady, and gold reached a new record closing high.
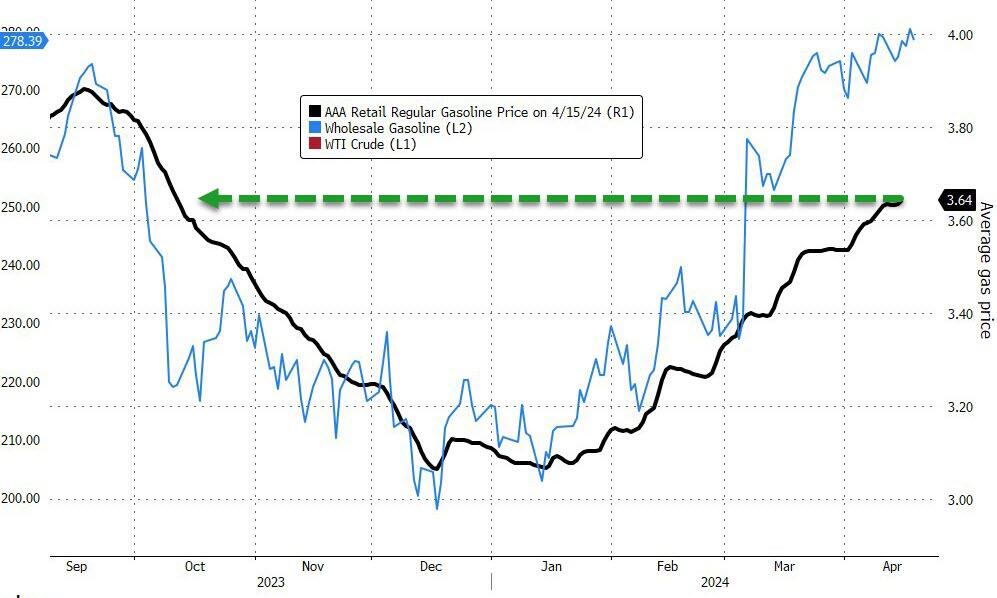
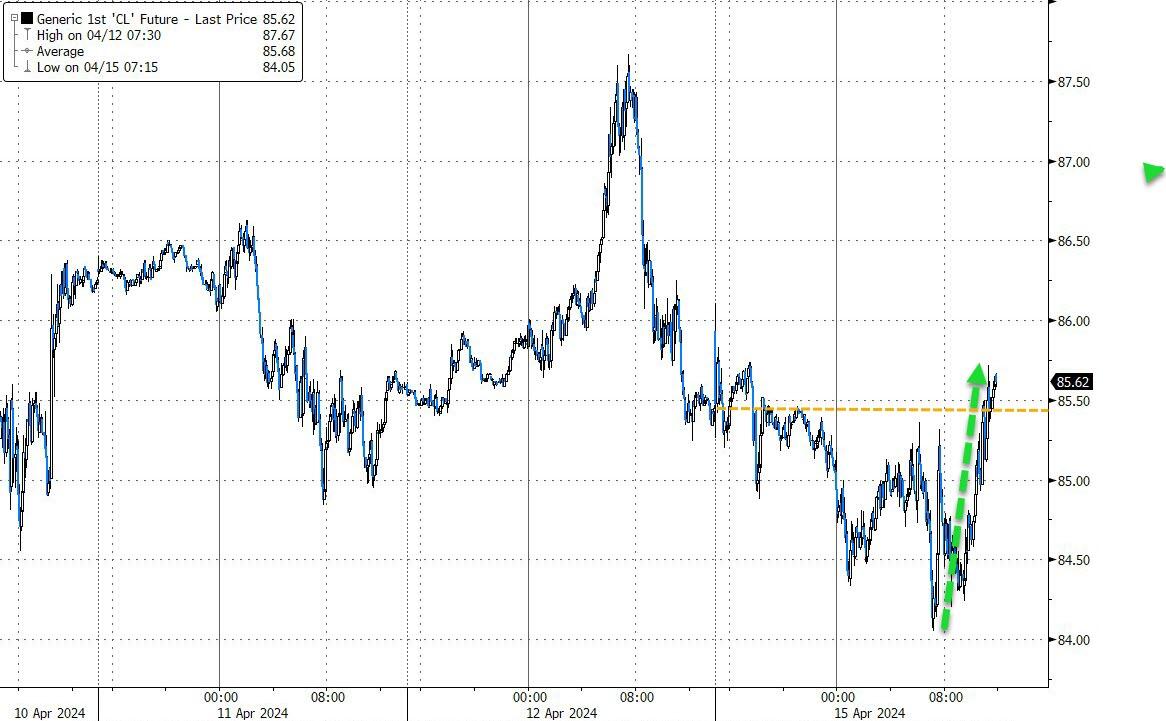
As gasoline prices continue their upward trajectory, one can’t help but ponder:
Will the now half empty Strategic Petroleum Reserve be tapped once more to temper the rising fuel costs?
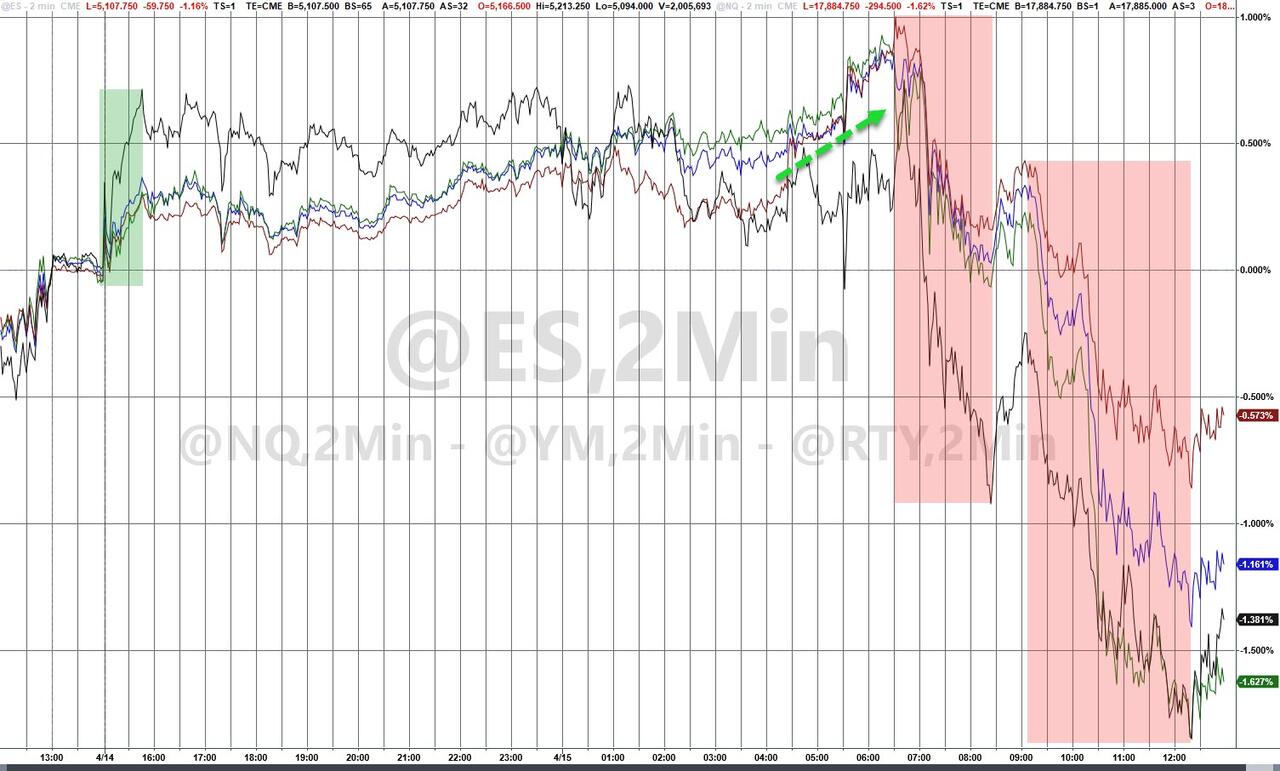
Despite a promising start with strong earnings from Goldman Sachs and encouraging retail data, the major indexes took a downturn, erasing the gains from the morning rally. The conflict in the Middle East remains a concern, but there is hope it won’t escalate further. Small Caps and the Mag7 stocks experienced a significant drop, reminiscent of the downturn two weeks prior.
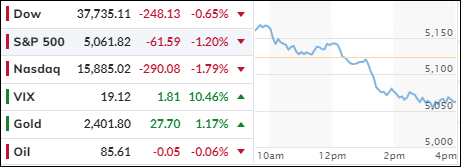
On Wall Street, a surge in retail sales by 0.7% in March—exceeding the expected 0.3%—signaled continued consumer strength despite the pressures of inflation. Yet, this positive economic indicator did not prevent the S&P 500 from slipping 1.2%, a stark contrast to its earlier 0.9% rise. The Nasdaq Composite fell even more, by 1.7%, with Salesforce and other tech stocks facing the brunt of the impact.
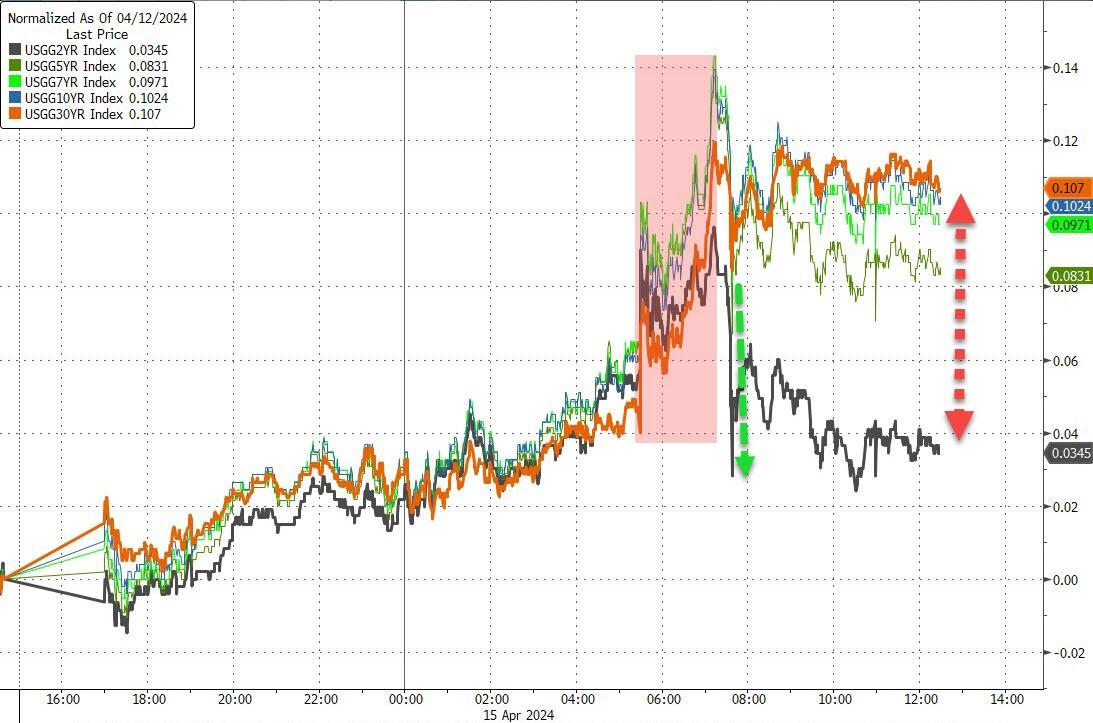
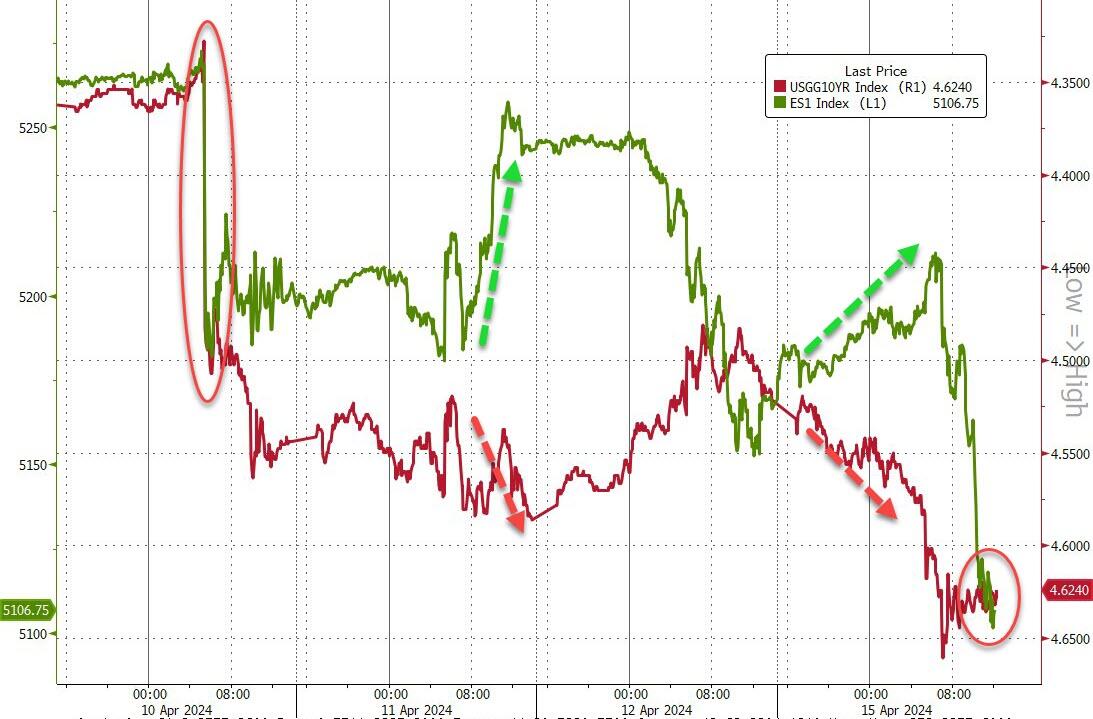
Interest rates rose, dampening the market’s initial optimism. The 10-year Treasury yield climbed past the pivotal 4.6% mark, reaching its highest point since mid-November. This increase came on the heels of the robust retail sales data.
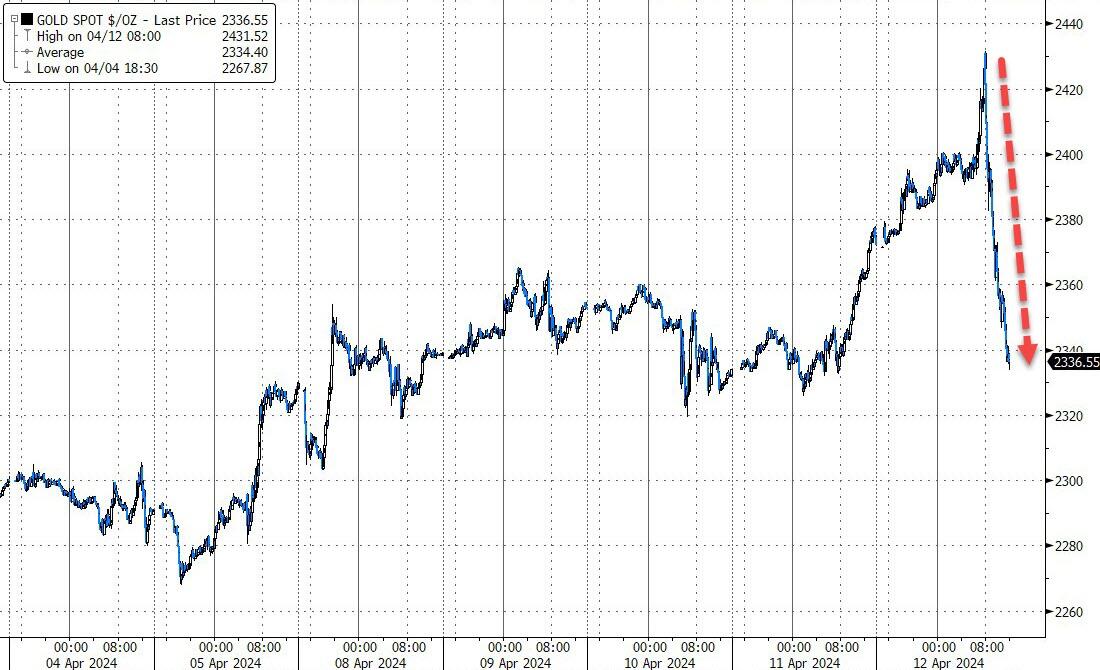
Gold experienced a rollercoaster, initially dropping over 1% to $2,346.00 an ounce, then rebounding with a 1.1% surge, breaking past the $2,400 threshold for the first time. This volatility follows gold’s record high last week, with an around 15% increase this year as investors flocked to the metal amidst persistent inflation and geopolitical unrest.
Oil prices saw a slight decline, relinquishing earlier gains, yet managed to recover from the day’s lows in later trading, exerting additional pressure on the market. The cumulative effect of Monday’s downturn added to the previous week’s significant losses, driven by ongoing inflation worries and a disappointing start to the corporate earnings season. Both the Dow and S&P 500 recorded their worst weekly performances since the previous year.
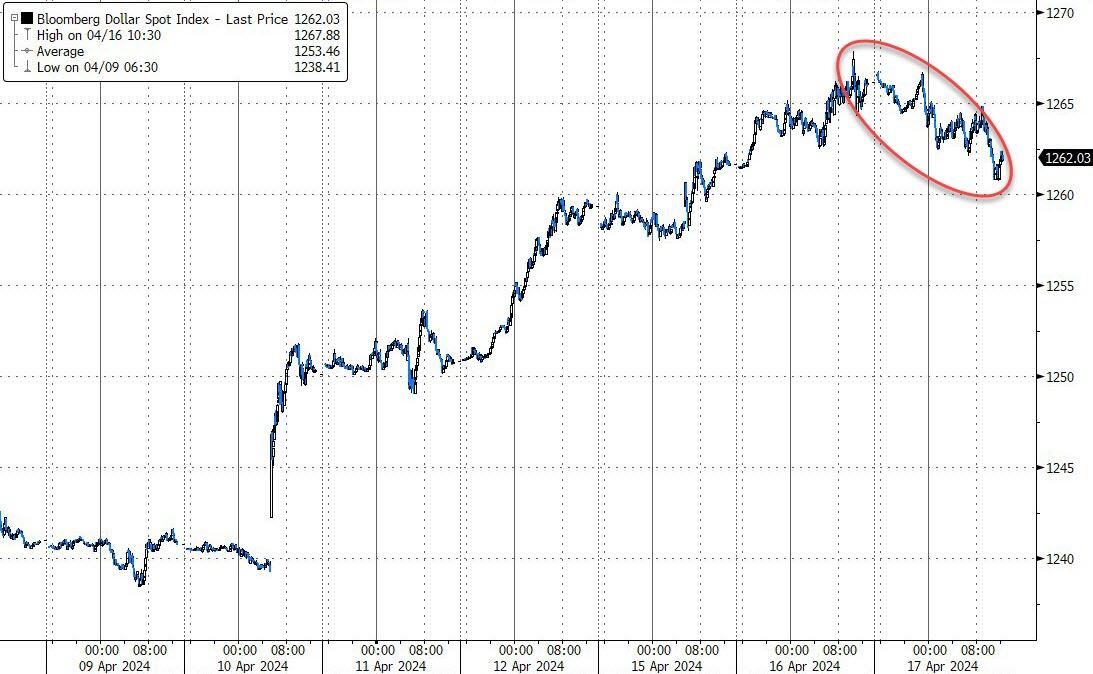
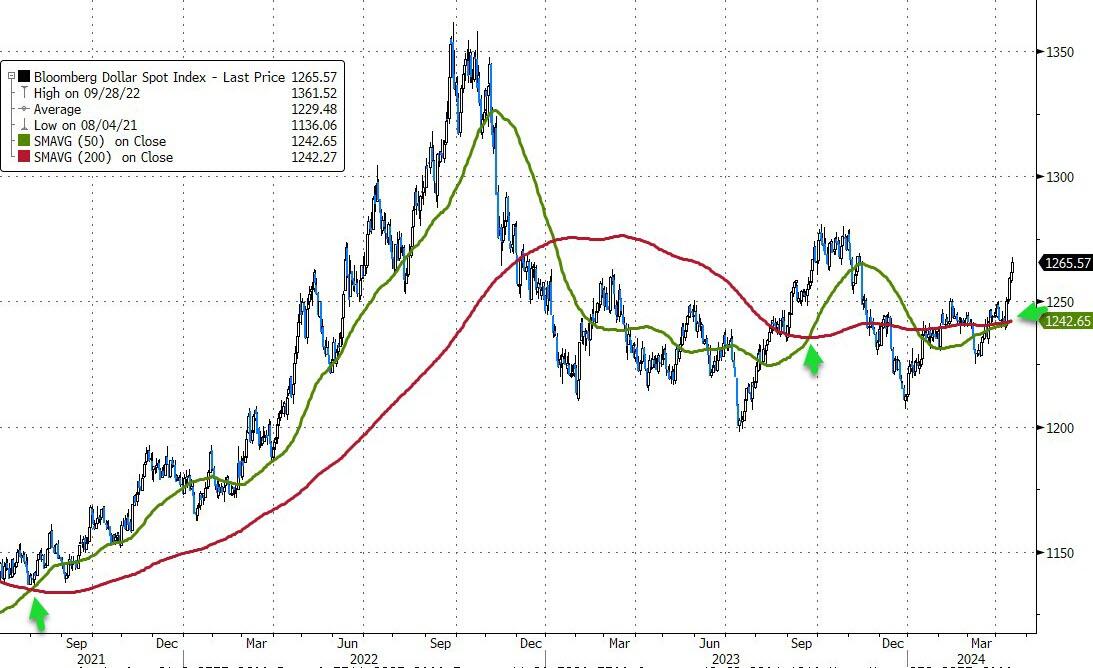
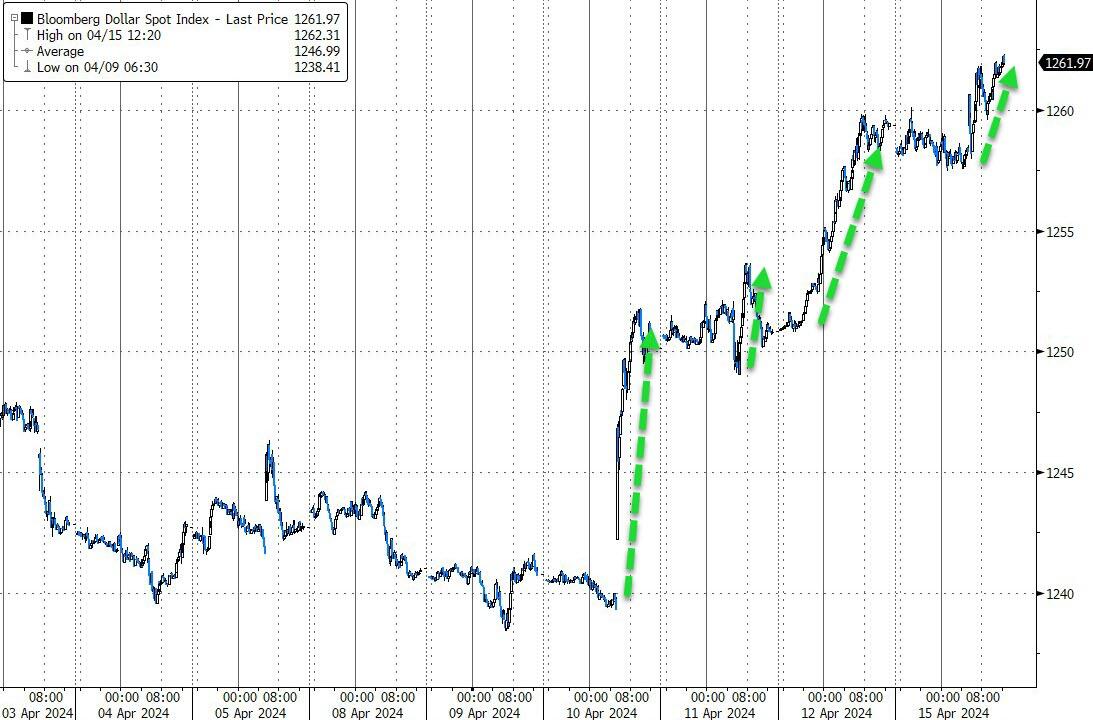
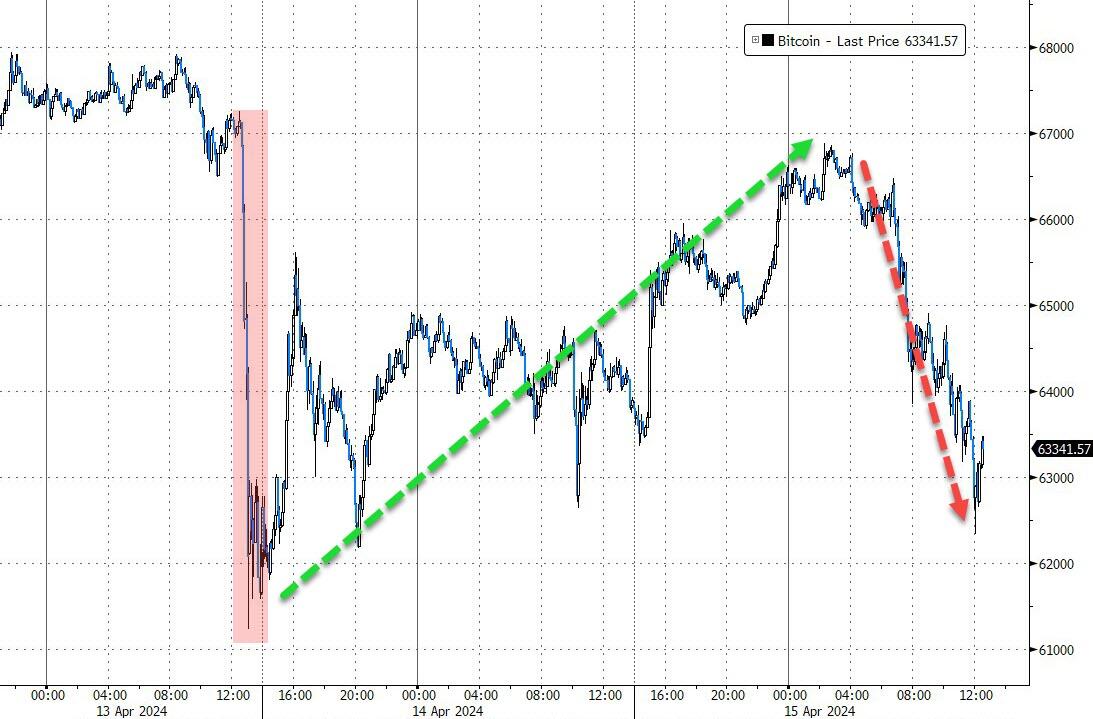
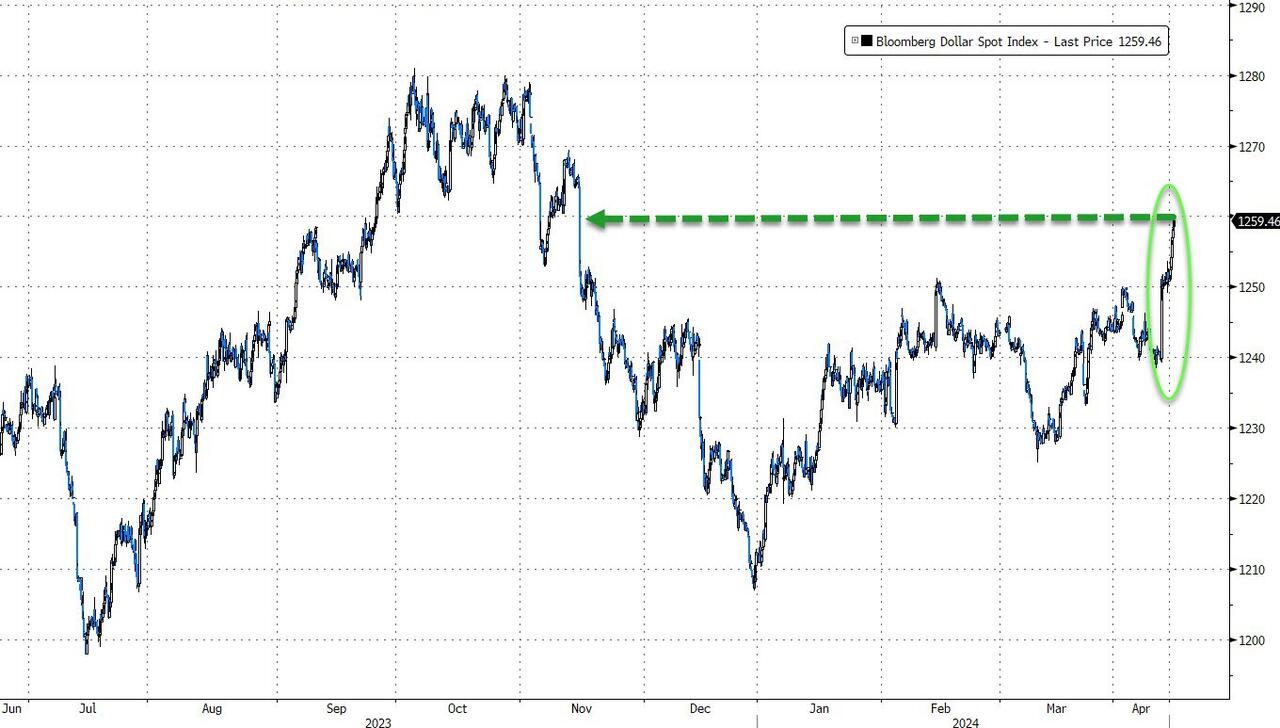
As bond yields soared and the dollar reached its highest level since November 13th, Bitcoin’s value declined, oil prices bounced back from initial losses, and gold fluctuated before closing at a new all-time high.
Ultimately, the S&P 500 adjusted downward, aligning with the reality of higher bond yields.
As we close out this Tax Day, could this be the turning point that marks the end of the current market correction?
Do you want to know which ETFs are hot and which ones are not? Then you need my High-Volume ETF Cutline report. It tells you how close or far each of the 311 ETFs I follow is from its long-term trend line (39-week SMA). These are the ETFs that trade more than $5 million a day, so they are not some obscure funds that nobody cares about.
The report is split into two parts: The winners that are above their trend line (%M/A), and the losers that are below it. The yellow line is the line of shame that separates them. You can see how many ETFs are in each group and how they have changed since the last report (270 vs. 244 current).
GOLD GLITTERS AMID MARKET GLOOM, OUTSHINES S&P 500 IN TURBULENT TIMES
[Chart courtesy of MarketWatch.com]
Moving the markets
Today, the stock market experienced a sharp decline as major U.S. banks began reporting their earnings amidst a backdrop of inflation and geopolitical tensions.
JPMorgan Chase’s shares fell over 6% following its first-quarter earnings report, which suggested that net interest income might fall short of analysts’ expectations for 2024. CEO Jamie Dimon highlighted ongoing inflationary pressures as a concern for the economy.
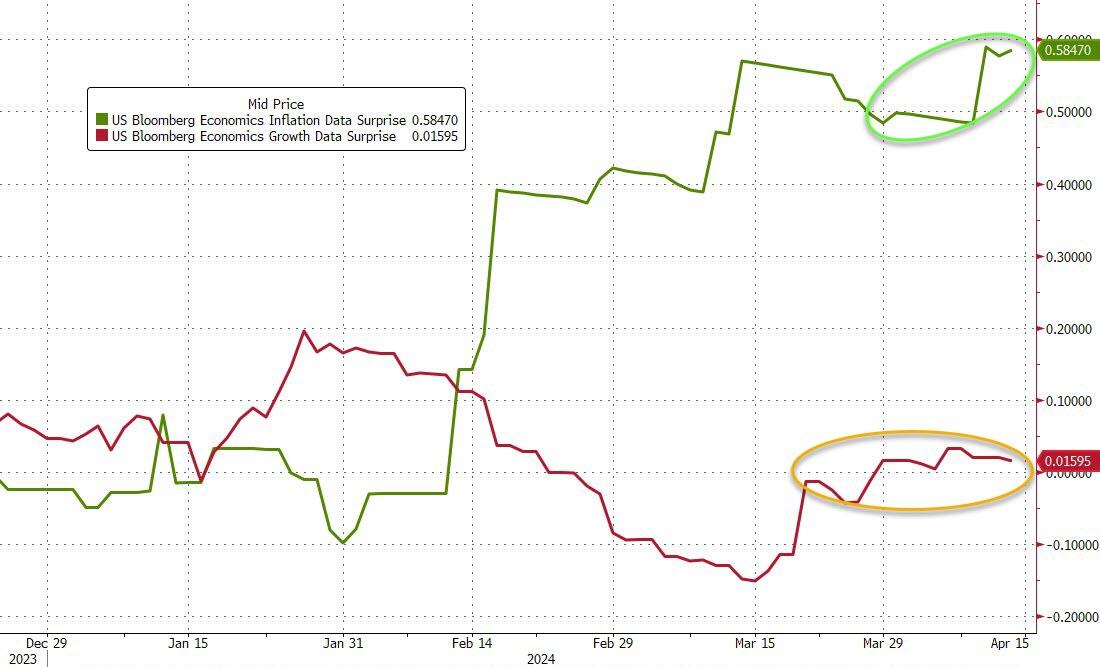
The persistent rise in inflation, which has yet to fully manifest, is causing traders to question the Federal Reserve’s ability to counteract this trend. This skepticism has been a recurring theme in my analysis over the past few years.
The combination of escalating debt, deficits, continuous military engagements, and diminishing confidence in the government has driven investors towards gold, which has yielded a year-to-date return of +13.45%, significantly outperforming the S&P 500’s +7.48%.
Oil prices have surged on reports of potential military action in the Middle East, contributing to the inflationary worries that are already pressuring the market. Meanwhile, the Federal Reserve’s indication of fewer rate cuts has raised concerns about asset valuations.
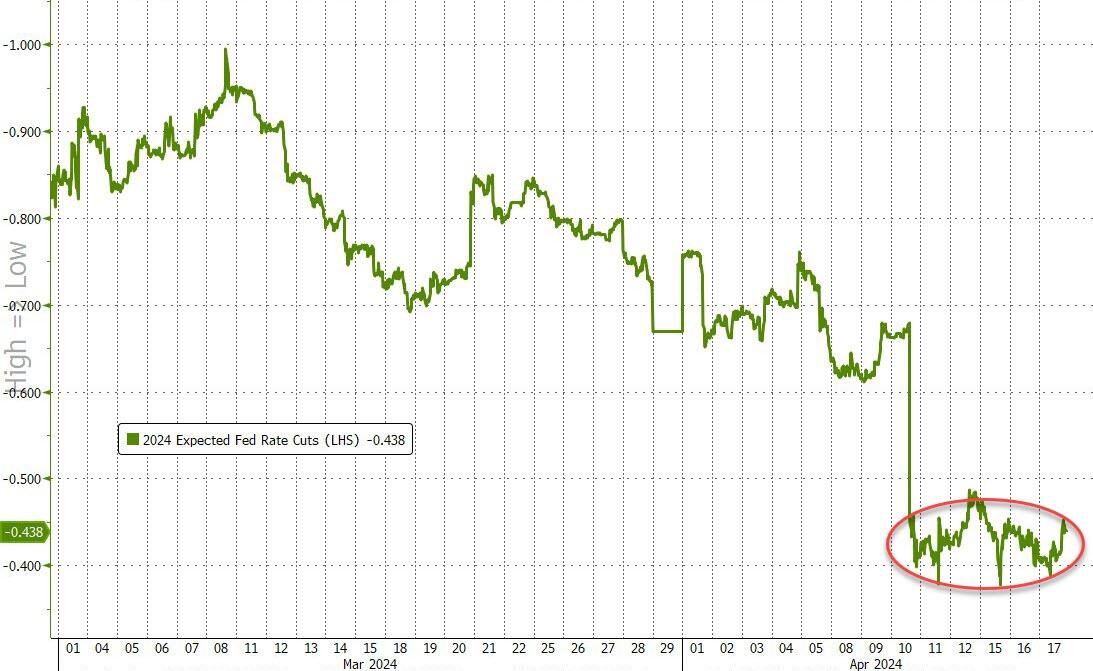
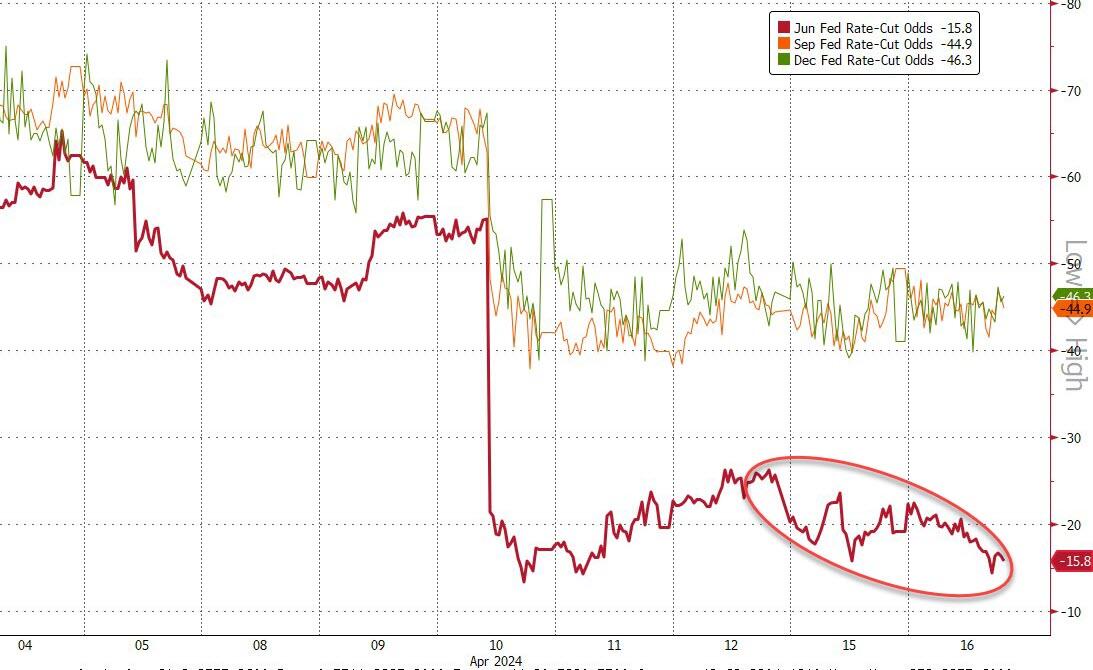
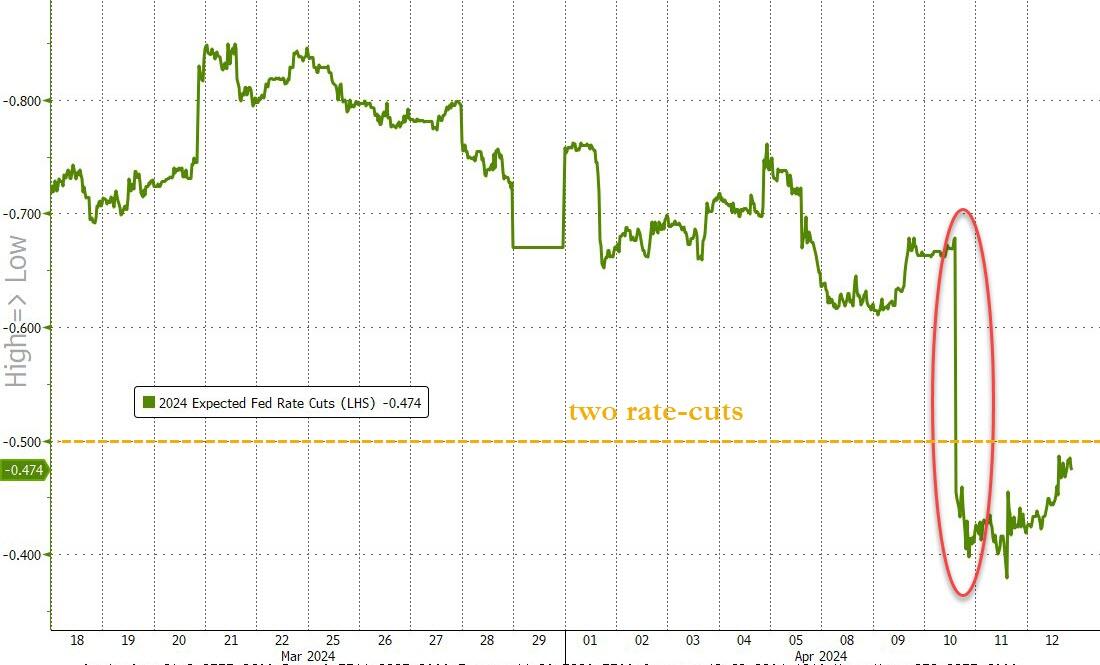
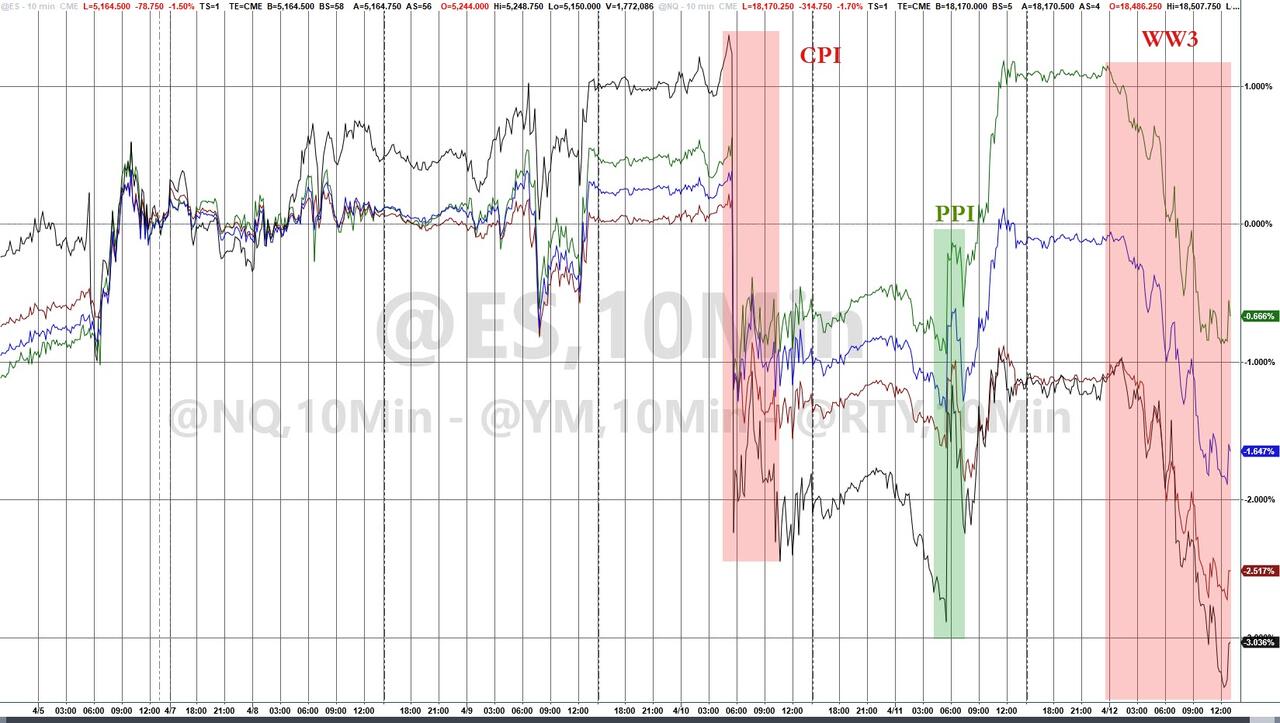
This week’s inflation indicators, including the Consumer Price Index (CPI) and Producer Price Index (PPI), came in hotter than expected, dampening the hopes of those anticipating rate reductions. With less than two rate cuts now anticipated for 2024, the market’s reaction was evident. Federal Reserve officials have echoed a consistent message, suggesting that interest rates may remain elevated for an extended period.
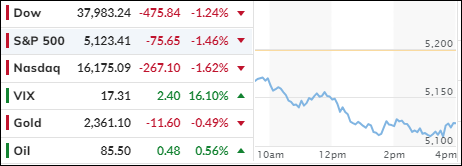
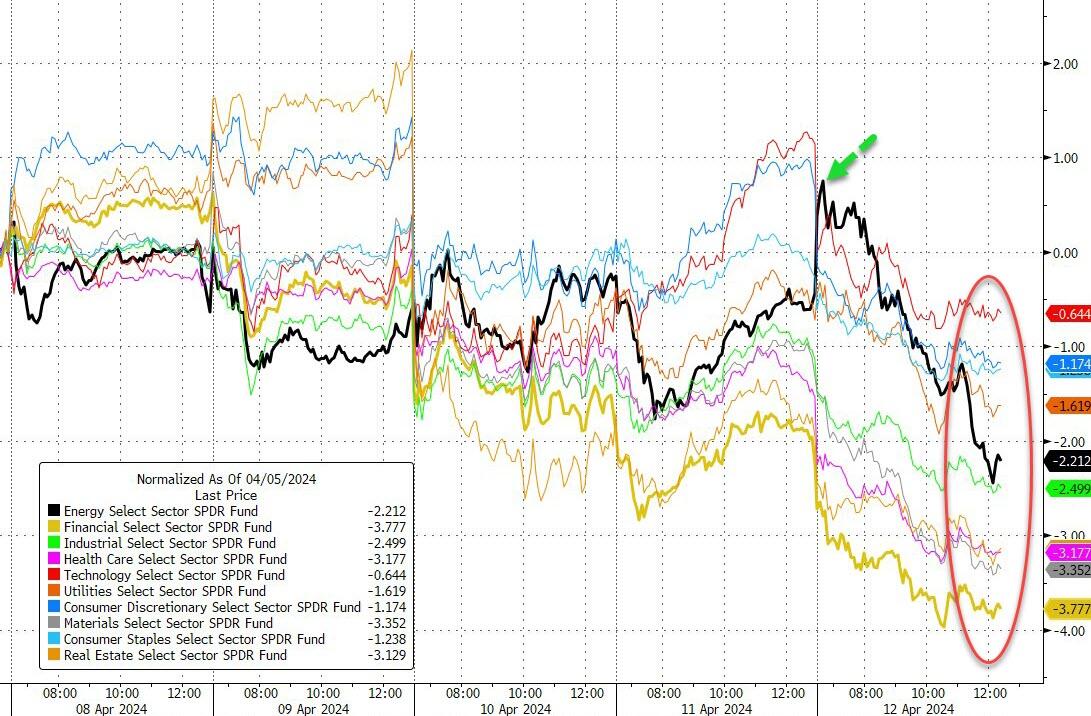
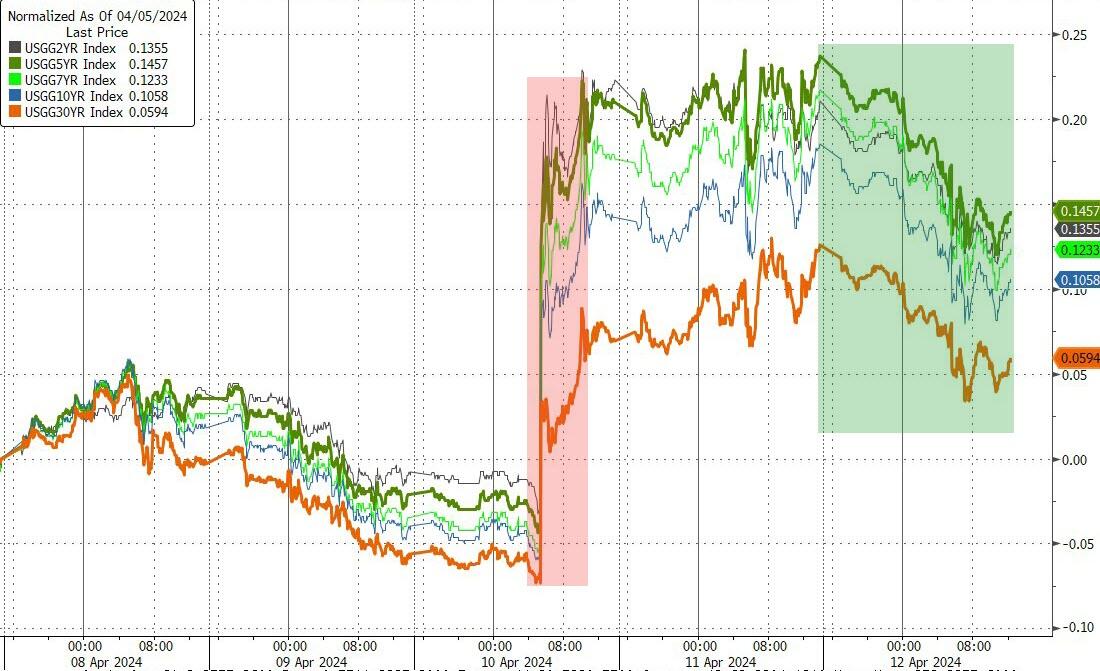
As the week concluded, all major stock indexes and sectors closed in the red, with Small Caps leading the downturn. Bond yields provided some refuge, rising over the week but dipping on the final day.
The U.S. dollar saw its largest increase since September 2022, while Bitcoin retracted its weekly gains. Gold, despite a strong start, ended the day lower after an initial 3% surge.
With the volatility potentially linked to the upcoming Tax Day on April 15, investors are left wondering:
Will the market’s performance post-Tax Day follow historical patterns?
