
- Moving the markets
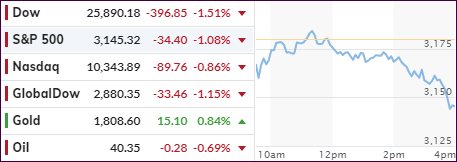
An early one-sided rally, dominated by the Nasdaq, lost momentum with all 3 major indexes hitting the skids and closing lower. The Nasdaq held up the best, while the Dow fared the harshest, but all closed at their worst levels of the session.
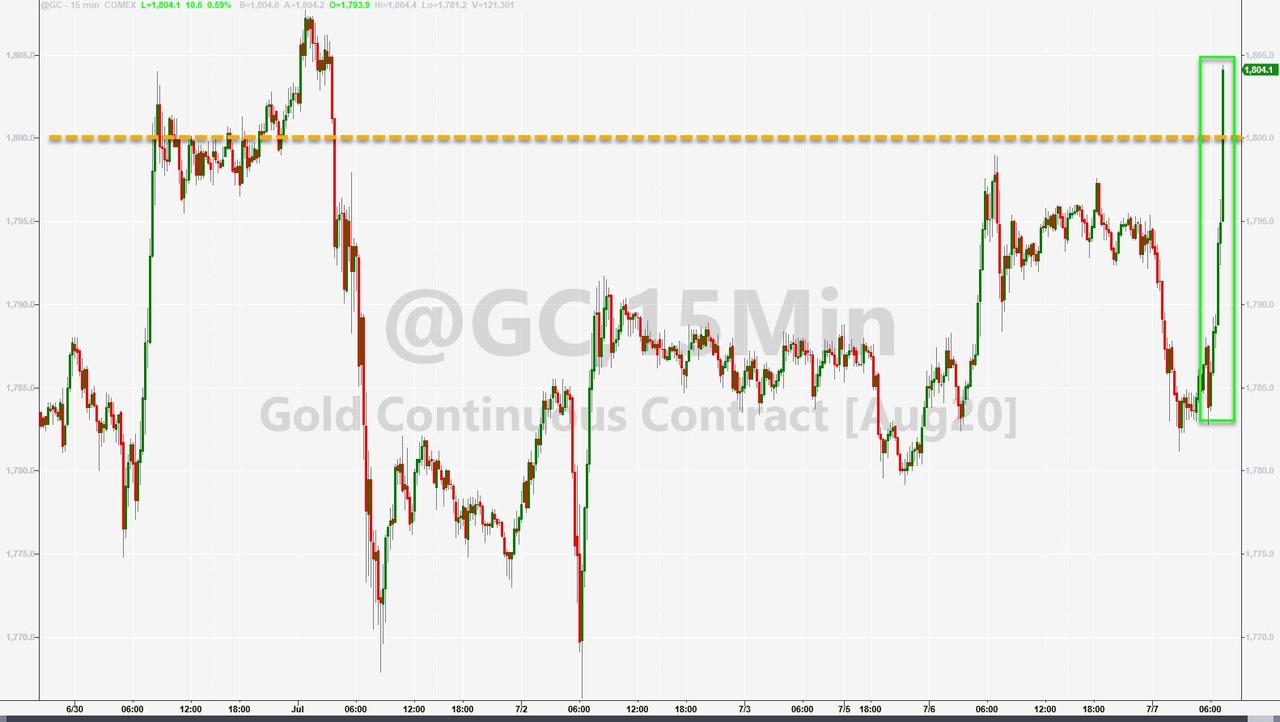
Saving the day was gold, which not only reclaimed its $1,800 level but also managed to solidly close above it thereby minimizing today’s modest fall of the tech sector. With the Fed’s reckless money printing continuing unabated, it’s only a matter of time before inflation rears its ugly head, while concurrently future monetary interventions may be of questionable value.
As Ron Paul recently wrote, with lending facilities providing to the Federal Reserve the ability to give money directly to businesses and governments, the Fed is now just one step away from implementing Ben Bernanke’s infamous suggestion that, if all else fails, the Fed can drop money from a helicopter. These interventions will not save the economy. Instead, they will make the inevitable crash more painful.
The next crash can bring about the end of the fiat monetary system. The question is not if the current monetary system ends, but when. The only way Congress can avoid the Fed causing another great depression is to begin transitioning to a free-market monetary system by auditing, then ending, the Fed.
While that does not mean the rally won’t continue, other concerns, like rising coronavirus infections, can dampen the buying mood on Wall Street, which was the case today. On the other hand, with the markets having been on a tear lately, a breather was necessary, and Covid-19 provided just such an excuse.
Be that as it may, with equities being totally depended on liquidity created by the Fed, anything is possible and can happen regarding market direction. It’s therefore imperative that you have an exit strategy in place to protect your portfolio from extreme downside risk.
2. ETFs in the Spotlight
In case you missed the announcement and description of this section, you can read it here again.
It features some of the 10 broadly diversified domestic and sector ETFs from my HighVolume list as posted every Saturday. Furthermore, they are screened for the lowest MaxDD% number meaning they have been showing better resistance to temporary sell offs than all others over the past year.
The below table simply demonstrates the magnitude with which these ETFs are fluctuating above or below their respective individual trend lines (%+/-M/A). A break below, represented by a negative number, shows weakness, while a break above, represented by a positive percentage, shows strength.
For hundreds of ETF choices, be sure to reference Thursday’s StatSheet.
For this new domestic “Buy” cycle, which ended effective 6/25/2020, here’s how some our candidates have fared:
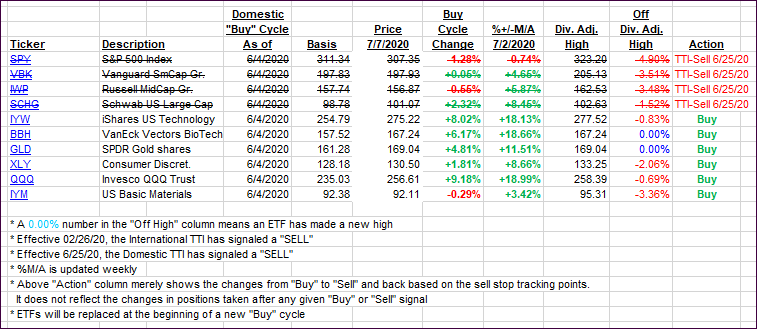
Click image to enlarge
Again, the %+/-M/A column above shows the position of the various ETFs in relation to their respective long-term trend lines, while the trailing sell stops are being tracked in the “Off High” column. The “Action” column will signal a “Sell” once the -8% point has been taken out in the “Off High” column. For more volatile sector ETFs, the trigger point is -10%.
3. Trend Tracking Indexes (TTIs)
Our TTIs pulled back with bears finally having a day in the sun.
This is how we closed 07/07/2020:
Domestic TTI: -1.70% below its M/A (prior close -0.11%)—Sell signal effective 06/25/2020
International TTI: -1.62% below its M/A (prior close -0.51%)—Sell signal effective 02/26/2020
Disclosure: I am obliged to inform you that I, as well as my advisory clients, own some of the ETFs listed in the above table. Furthermore, they do not represent a specific investment recommendation for you, they merely show which ETFs from the universe I track are falling within the specified guidelines.
Contact Ulli