
- Moving the markets
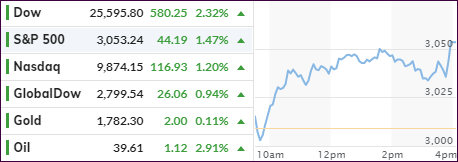
The explosion in US Pending Home Sales was the tie breaker today after reports that New Home Sales soared, and Existing Homes Sales plunged. The computer algos went with the rebound of 44.3% vs. 19.3% expected Pending Home Sales and pushed the major indexes to a solid green close, However, it was not enough to make up for Friday’s drubbing.
Still, concerns about the economic outlook was on traders’ minds, but hope prevailed that some of the planned shutdowns may be focused on only those areas with severe Covid-19 increases.
Coronavirus cases world-wide surpassed 10 million, with more than a half-million deaths. A dozen states, including Florida, Texas, California, and Arizona — now hot spots in the U.S. — reversed reopening plans and implemented tighter restrictions to prevent a further spread of the viral epidemic, The Wall Street Journal reported.
Some of today’s push to the upside was end-of-quarter adjustments by mutual funds, pension plans and investment managers, an activity that is also known as window dressing, which could certainly increase volatility during this Holiday-shortened week.
Added Peter Cardillo, chief market economist at Spartan Capital:
“However, the trend is likely to remain negative ahead of this week’s key macro indicators and the upcoming earnings season,” he said, referring to corporate quarterly results that kick off in earnest in the middle of July.
In the end we saw something unusual, as ZH pointed out:
Stocks up, Bonds up, Dollar up, Gold up, Bitcoin up… COVID-cases Up…
That’s all part of the new normal.
2. ETFs in the Spotlight
In case you missed the announcement and description of this section, you can read it here again.
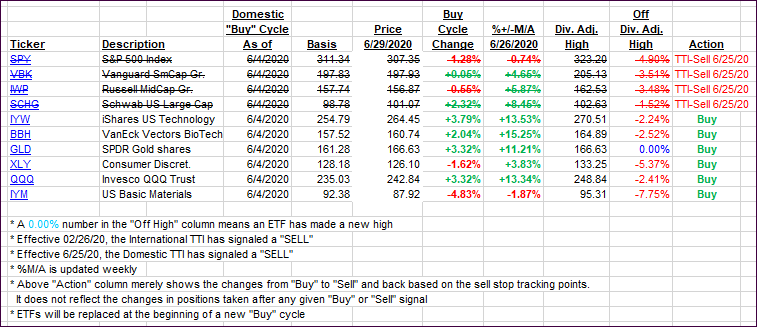
It features some of the 10 broadly diversified domestic and sector ETFs from my HighVolume list as posted every Saturday. Furthermore, they are screened for the lowest MaxDD% number meaning they have been showing better resistance to temporary sell offs than all others over the past year.
The below table simply demonstrates the magnitude with which these ETFs are fluctuating above or below their respective individual trend lines (%+/-M/A). A break below, represented by a negative number, shows weakness, while a break above, represented by a positive percentage, shows strength.
For hundreds of ETF choices, be sure to reference Thursday’s StatSheet.
For this new domestic “Buy” cycle, which ended effective 6/25/2020, here’s how some our candidates have fared:
Click image to enlarge
Again, the %+/-M/A column above shows the position of the various ETFs in relation to their respective long-term trend lines, while the trailing sell stops are being tracked in the “Off High” column. The “Action” column will signal a “Sell” once the -8% point has been taken out in the “Off High” column. For more volatile sector ETFs, the trigger point is -10%.
3. Trend Tracking Indexes (TTIs)
Our TTIs both improved but remain stuck on the bearish side of their trend lines.
This is how we closed 06/29/2020:
Domestic TTI: -3.01% below its M/A (prior close -4.91%)—Sell signal effective 06/25/2020
International TTI: -4.46% below its M/A (prior close -5.29%)—Sell signal effective 02/26/2020
Disclosure: I am obliged to inform you that I, as well as my advisory clients, own some of the ETFs listed in the above table. Furthermore, they do not represent a specific investment recommendation for you, they merely show which ETFs from the universe I track are falling within the specified guidelines.
Contact Ulli