
- Moving the markets
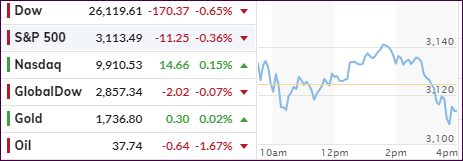
After three days of gains, the major indexes traded near their respective unchanged lines but dove into the red during the last hour. The exception was the Nasdaq, which gave up mid-day gains but ended up in the green.
Contributing to the sell-off were reports that coronavirus cases were on the rise in at least 9 US states and China, but hope remains that a quick recovery will be still possible. Fed chair Powell continued with his second day testimonial before Congress, and while emphasizing the lasting toll of the pandemic, he also suggested that unemployment benefits should be extended.
Powell also said some form of unemployment insurance should continue past the expiration date of July 31 and defended the central bank’s more than $2 trillion slate of emergency funding to keep credit flowing during the pandemic.
Overall, the trading range of the indexes was relatively small, but that could change in a hurry with an uptick in volatility.
As ZH explained, first, there is a massive option expiration set for this Friday the 19th with some $1.8 trillion in SPX options to expire, which makes it the 3rd largest non-December expiration on record.
Second, there is massive pension selling ahead towards the end of the month, at the tune of $76 billion, due to outperformance of stocks over bonds this quarter. The required rebalancing makes this an unavoidable event.
The question is: “How much downside will come into play and will it affect our current bullish theme?”
Since no one has that answer, we will need to be prepared for either scenario.
2. ETFs in the Spotlight
In case you missed the announcement and description of this section, you can read it here again.
It features some of the 10 broadly diversified domestic and sector ETFs from my HighVolume list as posted every Saturday. Furthermore, they are screened for the lowest MaxDD% number meaning they have been showing better resistance to temporary sell offs than all others over the past year.
The below table simply demonstrates the magnitude with which these ETFs are fluctuating above or below their respective individual trend lines (%+/-M/A). A break below, represented by a negative number, shows weakness, while a break above, represented by a positive percentage, shows strength.
For hundreds of ETF choices, be sure to reference Thursday’s StatSheet.
For this new domestic “Buy” cycle, which was effective 6/4/2020, here’s how some our candidates have fared:
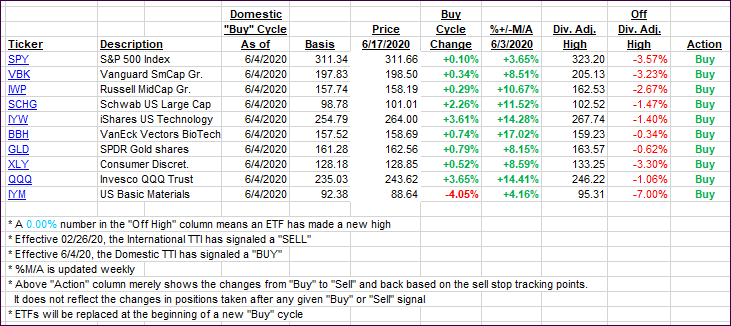
Click image to enlarge
Again, the %+/-M/A column above shows the position of the various ETFs in relation to their respective long-term trend lines, while the trailing sell stops are being tracked in the “Off High” column. The “Action” column will signal a “Sell” once the -8% point has been taken out in the “Off High” column. For more volatile sector ETFs, the trigger point is -10%.
3. Trend Tracking Indexes (TTIs)
Our TTIs headed south with the Domestic one slipping a tad below its trend line, which was not enough of a move for us to take evasive action.
This is how we closed 06/17/2020:
Domestic TTI: -0.03% below its M/A (prior close +1.10%)—Buy signal effective 06/04/2020
International TTI: -2.89% below its M/A (prior close -2.77%)—Sell signal effective 02/26/2020
Disclosure: I am obliged to inform you that I, as well as my advisory clients, own some of the ETFs listed in the above table. Furthermore, they do not represent a specific investment recommendation for you, they merely show which ETFs from the universe I track are falling within the specified guidelines.
Contact Ulli