
ETF Tracker StatSheet
You can view the latest version here.
DIVING INTO THE WEEKEND
- Moving the markets
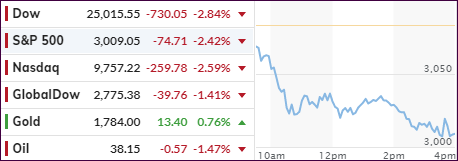
Yesterday’s late pump vanished in a hurry this morning, as the major indexes opened in the red, slipped but found some mid-day support, before diving into the close.
News of spikes in coronavirus cases were the cause with Texas and Florida taking drastic action by re-closing bars again. In other words, we’re backtracking the re-opening efforts, which should put a nail in the coffin of the highly anticipated V-shape recovery.
Even 2 of the White House mouth pieces could not stop the downward trend:
1510ET *KUDLOW SAYS EVERY NUMBER IS SHOWING V-SHAPE RECOVERY FOR U.S.
1515ET *MNUCHIN: WILL GO BACK TO CONGRESS NEXT MONTH FOR MORE TOOLS
Also not helping were new restrictions on banks, which MarketWatch summed up like this:
Investors are also digesting the results of the Federal Reserve’s annual bank stress tests which requires banks to preserve capital by suspending share repurchases and cap dividend payments in the third quarter based on average net income over the past four quarters.
However:
Financial institutions got a boost on Thursday after the Federal Deposit Insurance Commission and Office of the Comptroller of the Currency said they are planning to loosen the restrictions imposed by the Volcker rule and allow banks to more easily make large investments into venture capital and similar funds, among other rule rollbacks.
For the week, the indexes got slammed with the S&P 500 surrendering some -2.9% supporting our decision follow our TTI and move to the safety of the sidelines.
Coinciding with my “Sell” signal were several cycle analysts, who forecast this week, and into the 30th of this month, to be the end of this current rebound.
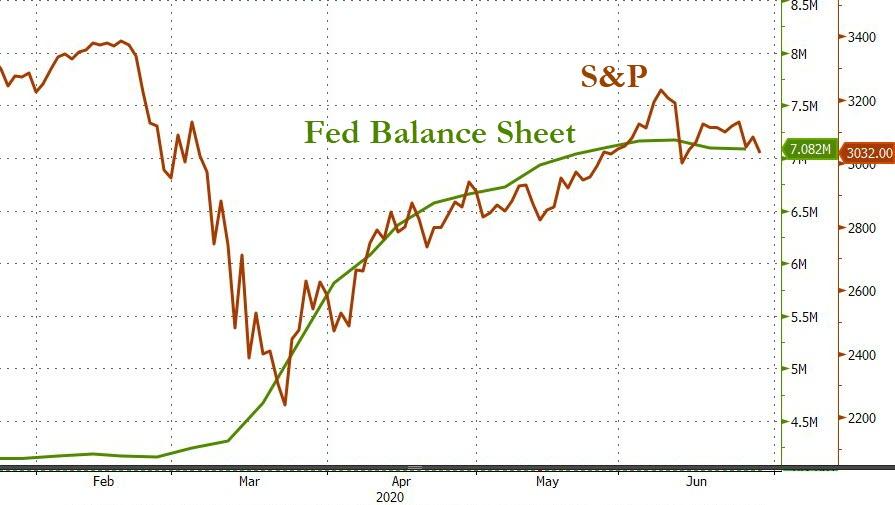
Remember, this past bullish period did not occur because of economic fundamentals, it was merely a gift by the Fed via generating enormous amounts of liquidity, which was soaked up by the markets.
Analyst Sven Henrich saw it this way:
No bull market without central bank intervention has now been proven beyond a reasonable doubt. The Fed is busted, and Wall Street exposed to be nothing but a suckling at the Fed’s liquidity chest.
Rallies still occur when the Fed intervenes. But despite two interventions in June prices now remain below the June 8th peak. The Fed and markets now have to prove they can exceed above these prices or potentially face the point of singularity: No bull market even with central bank intervention. If they can’t, then this bear market will come out of hiding.
What that means is that any further bullishness will be a function of the Fed throwing an assist, especially if the Covid-19 woes continue. If the Fed does not act, you can be assured that we will be re-visiting the March lows.
2. ETFs in the Spotlight
In case you missed the announcement and description of this section, you can read it here again.
It features some of the 10 broadly diversified domestic and sector ETFs from my HighVolume list as posted every Saturday. Furthermore, they are screened for the lowest MaxDD% number meaning they have been showing better resistance to temporary sell offs than all others over the past year.
The below table simply demonstrates the magnitude with which these ETFs are fluctuating above or below their respective individual trend lines (%+/-M/A). A break below, represented by a negative number, shows weakness, while a break above, represented by a positive percentage, shows strength.
For hundreds of ETF choices, be sure to reference Thursday’s StatSheet.
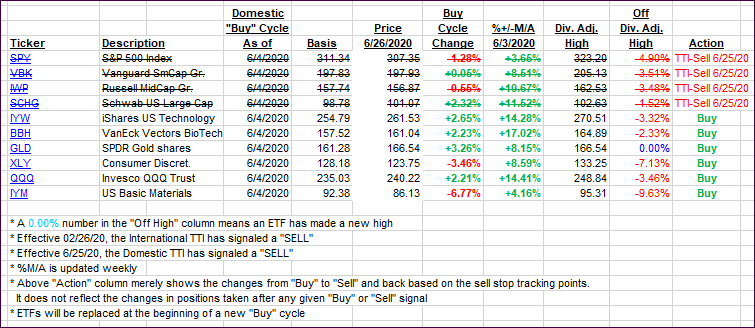
For this new domestic “Buy” cycle, which ended effective 6/25/2020, here’s how some our candidates have fared:
Click image to enlarge
Again, the %+/-M/A column above shows the position of the various ETFs in relation to their respective long-term trend lines, while the trailing sell stops are being tracked in the “Off High” column. The “Action” column will signal a “Sell” once the -8% point has been taken out in the “Off High” column. For more volatile sector ETFs, the trigger point is -10%.
3. Trend Tracking Indexes (TTIs)
Our TTIs recovered some as, after an early 200-point dump, the markets were pushed higher in the last 30 minutes, with a massive Buy program assisting the bulls.
This is how we closed 06/26/2020:
Domestic TTI: -4.91% below its M/A (prior close -3.51%)—Sell signal effective 06/25/2020
International TTI: -5.29% below its M/A (prior close -4.10%)—Sell signal effective 02/26/2020
Disclosure: I am obliged to inform you that I, as well as my advisory clients, own some of the ETFs listed in the above table. Furthermore, they do not represent a specific investment recommendation for you, they merely show which ETFs from the universe I track are falling within the specified guidelines.
———————————————————-
WOULD YOU LIKE TO HAVE YOUR INVESTMENTS PROFESSIONALLY MANAGED?
Do you have the time to follow our investment plans yourself? If you are a busy professional who would like to have his portfolio managed using our methodology, please contact me directly or get more details here.
———————————————————
Back issues of the ETF Tracker are available on the web.
Contact Ulli