
- Moving the markets
While the jury is still out whether we’re experiencing a bear market bounce or have moved into a new bullish cycle, I was surprised to read that two-thirds of fund managers are saying we’re still in a bear market rally.
I agree with that but will change my mind once our Trend Tracking Indexes (TTIs) generate a new “Buy” signal.
Three-quarters of the fund managers expect a U- or W-shaped economic recovery with just 10% anticipating a V-shape rebound:
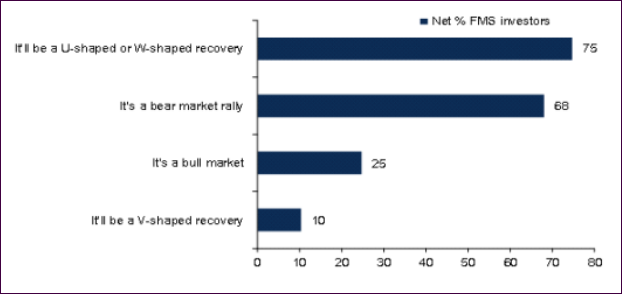
This pessimism is reflected in their current allocations, where overweight in defensive assets like health care, cash, bonds rules and cyclical assets like energy, equities and foreign investments are underweight, while emerging markets have been shorted.
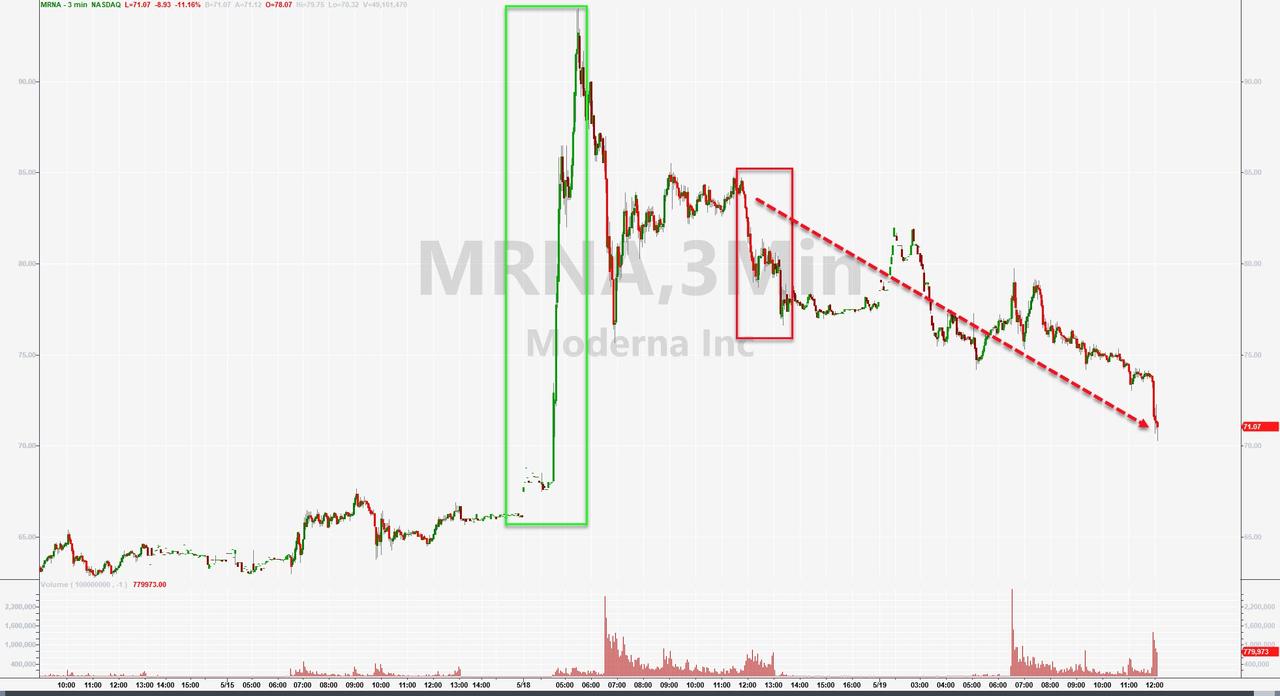
In a follow up from yesterday’s ridiculous yet market moving story about Moderna’s coronavirus vaccine press release, and the effect of its result on 8 patients, it was concluded that much of it was simply a media blitz with some allegations of stock manipulation.
“Even the figures the company did release don’t mean much on their own, because critical information — effectively the key to interpreting them — was withheld.”
The pushback was fast and furious with Moderna’s stock dumping not only to session lows but also below its offering price of $76/share.
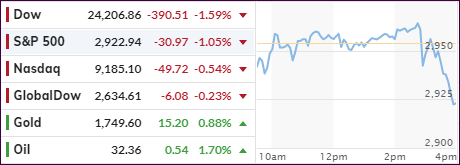
The rest of the market bobbed and weaved for most of the day until the last hour when heavy selling set in and wiped out just about half of yesterday’s gains, as the fallout from the Moderna saga was too much for the bulls to handle.
After Fed head Powell and Treasury Secretary Mnuchin’s grilling by the senate banking committee, it was Boston Fed Reserve President Rosengren, during a CNBC interview, who through some somber thoughts about the possibly “premature” business re-openings due to Americans continue to content psychologically with the Covid-19 pandemic.
With many traders still erroneously expecting a fast and furious V-shape type of economic recovery, these were the wrong words to utter by an official, and downside momentum accelerated into the close, and we ended up at the lows for the day.
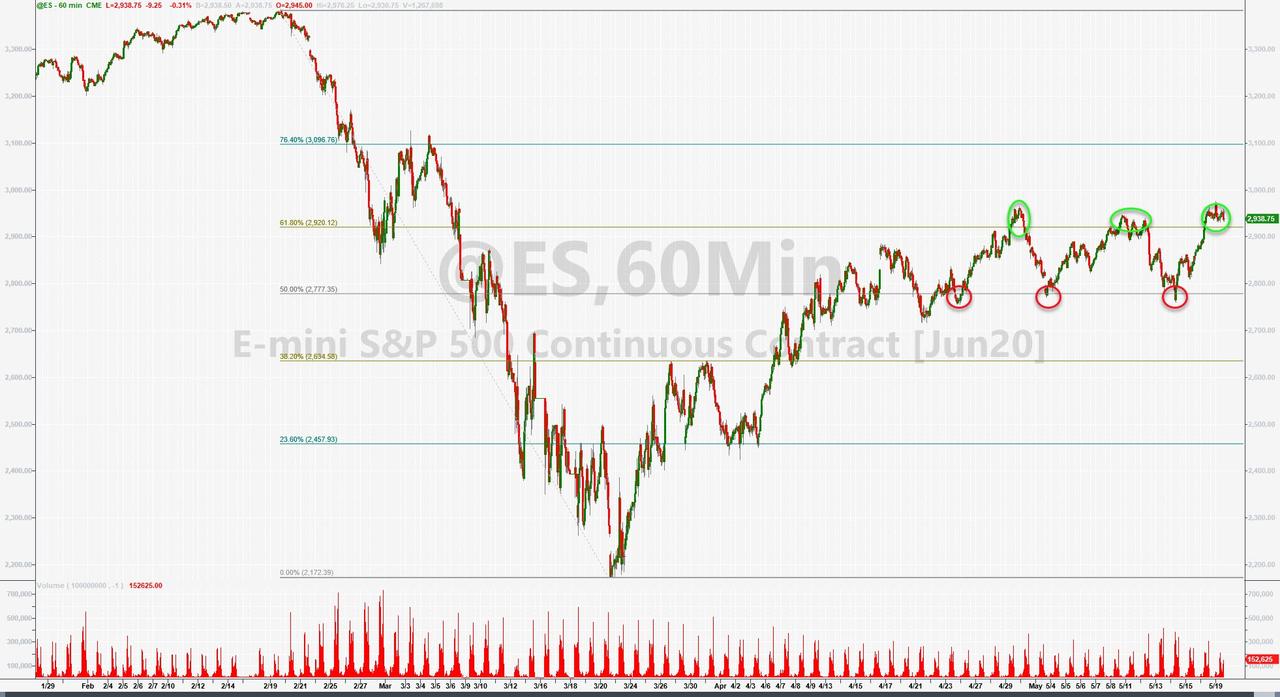
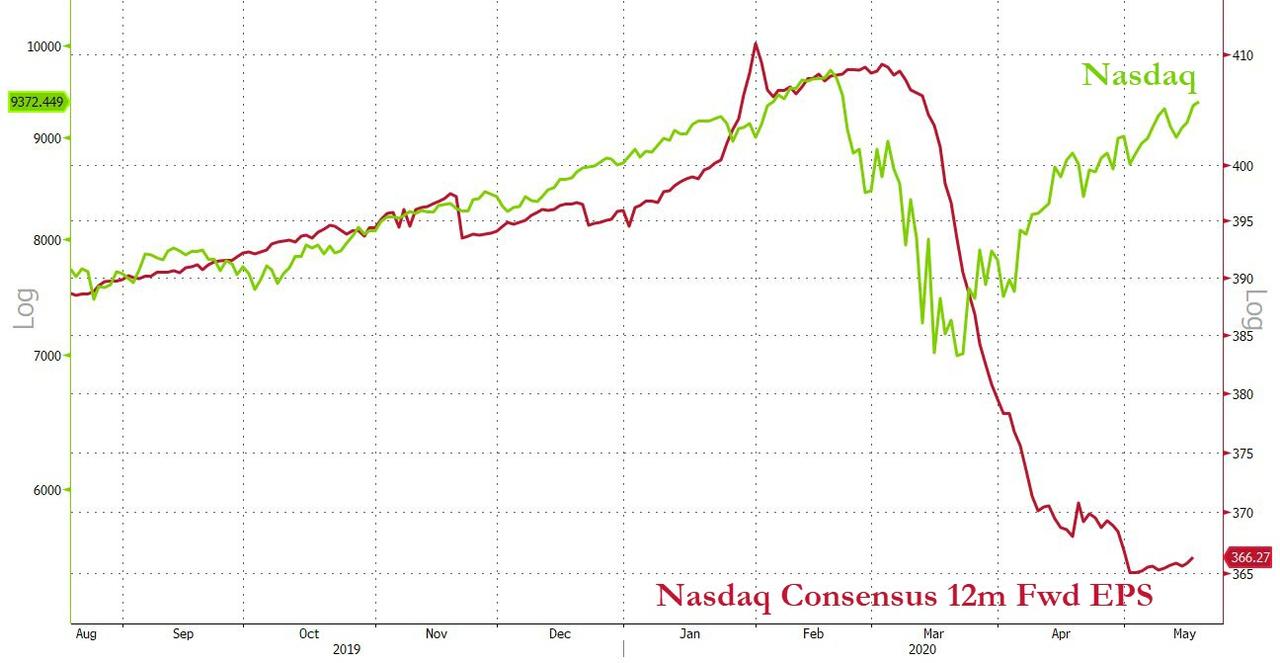
The S&P 500 has now formed a triple-top with strong overhead resistance lurking at the 2,950 level. The earnings divergence in the Nasdaq continued, as this chart by Bloomberg shows, and makes me wonder how long this can go on, namely the Nasdaq being just 5% from record highs, while consensus 12 month Fwd EPS is down 11%? (Hat tip to ZH for this data)
However, we’re living in times where anything nonsensible is possible, which is clearly supported by these words from Fed chief Powell that they will do “whatever it takes.”
2. ETFs in the Spotlight
In case you missed the announcement and description of this section, you can read it here again.
It features some of the 10 broadly diversified domestic and sector ETFs from my HighVolume list as posted every Saturday. Furthermore, they are screened for the lowest MaxDD% number meaning they have been showing better resistance to temporary sell offs than all others over the past year.
The below table simply demonstrates the magnitude with which these ETFs are fluctuating above or below their respective individual trend lines (%+/-M/A). A break below, represented by a negative number, shows weakness, while a break above, represented by a positive percentage, shows strength.
For hundreds of ETF choices, be sure to reference Thursday’s StatSheet.
For this past domestic “Buy” cycle, which ended on 2/27/2020, here’s how some our candidates have fared:
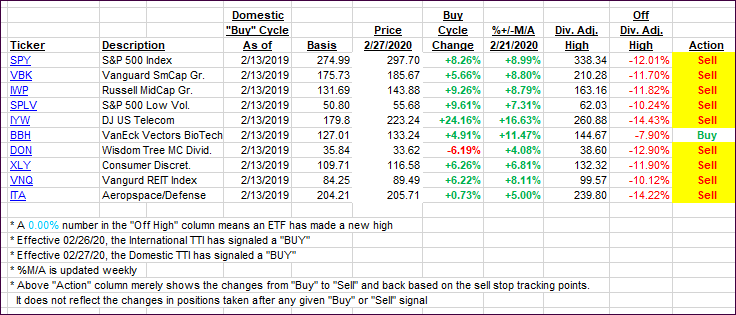
Click image to enlarge
Again, the %+/-M/A column above shows the position of the various ETFs in relation to their respective long-term trend lines, while the trailing sell stops are being tracked in the “Off High” column. The “Action” column will signal a “Sell” once the -8% point has been taken out in the “Off High” column. For more volatile sector ETFs, the trigger point is -10%.
3. Trend Tracking Indexes (TTIs)
Our TTIs reversed with the markets collapsing during the last hour of trading.
This is how we closed 05/19/2020:
Domestic TTI: -9.10% below its M/A (prior close -7.82%)—Sell signal effective 02/27/2020
International TTI: -11.09% below its M/A (prior close -10.80%)—Sell signal effective 02/26/2020
Disclosure: I am obliged to inform you that I, as well as my advisory clients, own some of the ETFs listed in the above table. Furthermore, they do not represent a specific investment recommendation for you, they merely show which ETFs from the universe I track are falling within the specified guidelines.
Contact Ulli