
- Moving the markets
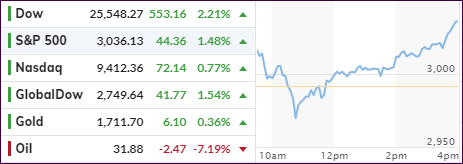
After the Dow and the S&P 500 battled with their overhead resistance yesterday, it was a different story today, when, after some early morning bobbing and weaving, the major indexes reestablished upward momentum and off we went.
You would have thought that dismal economic data and rising US-China tensions would have imparted a sense of reality, but that did not happen. Even the Fed’s beige book was filled with alarming notes about the economic devastation, with the hardest-hit industries being retail, travel, and hospitality, but none of it mattered.
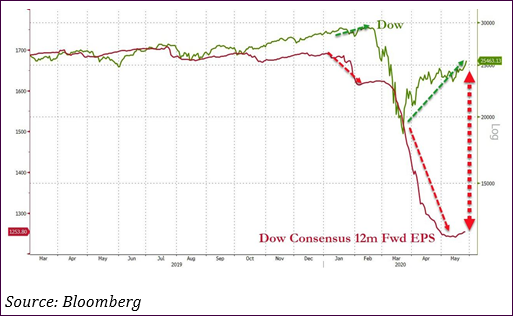
Then we learned that one of the former main drivers of the stock market, namely profits, posted a record decline. Zero Hedge noted:
S&P 500 companies posted a record decline in Q1 operating profits, exceeding the previous single-quarter collapse that occurred during the Great Financial Recession.
The decline in Q2 operating profits will prove to be far bigger. Corporate solvency risks are alive and growing. Equity valuations are at nosebleed levels. A retesting of the March lows in the equity market is a probable outcome.
Yet, none of these data points are a problem at this time—until one day, when they will…
Currently, it’s all about the Fed’s intentions of bailing out anyone that needs it, and it’s now a matter of experiencing one more market collapse, after which the Fed will decide to purchase stocks outright.
On the other hand, you must ask yourself, how long can this go on?
I am continuing to look for more suitable sector ETFs, but it appears that a new Domestic “Buy” will be in our near future (see section 3).
2. ETFs in the Spotlight
In case you missed the announcement and description of this section, you can read it here again.
It features some of the 10 broadly diversified domestic and sector ETFs from my HighVolume list as posted every Saturday. Furthermore, they are screened for the lowest MaxDD% number meaning they have been showing better resistance to temporary sell offs than all others over the past year.
The below table simply demonstrates the magnitude with which these ETFs are fluctuating above or below their respective individual trend lines (%+/-M/A). A break below, represented by a negative number, shows weakness, while a break above, represented by a positive percentage, shows strength.
For hundreds of ETF choices, be sure to reference Thursday’s StatSheet.
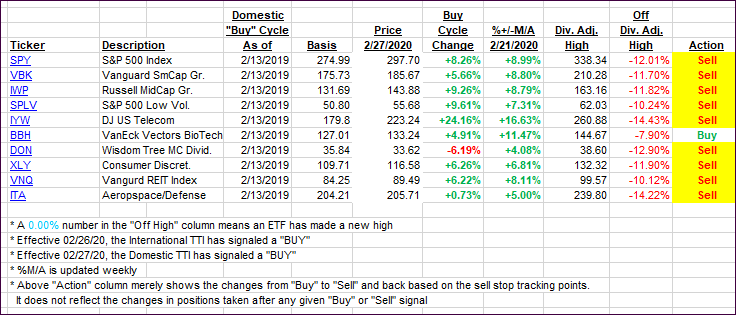
For this past domestic “Buy” cycle, which ended on 2/27/2020, here’s how some our candidates have fared:
Click image to enlarge
Again, the %+/-M/A column above shows the position of the various ETFs in relation to their respective long-term trend lines, while the trailing sell stops are being tracked in the “Off High” column. The “Action” column will signal a “Sell” once the -8% point has been taken out in the “Off High” column. For more volatile sector ETFs, the trigger point is -10%.
3. Trend Tracking Indexes (TTIs)
Our TTIs rallied with the Domestic one again showing more strength.
This is how we closed 05/27/2020:
Domestic TTI: -2.33% below its M/A (prior close -4.69%)—Sell signal effective 02/27/2020
International TTI: -7.00% below its M/A (prior close -8.40%)—Sell signal effective 02/26/2020
Disclosure: I am obliged to inform you that I, as well as my advisory clients, own some of the ETFs listed in the above table. Furthermore, they do not represent a specific investment recommendation for you, they merely show which ETFs from the universe I track are falling within the specified guidelines.
Contact Ulli