
ETF Tracker StatSheet
You can view the latest version here.
MARKETS RALLY ON HORRIFIC ECONOMIC DATA
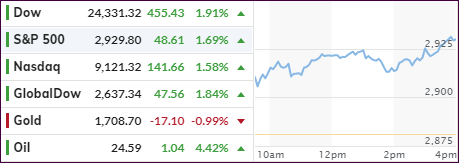
- Moving the markets
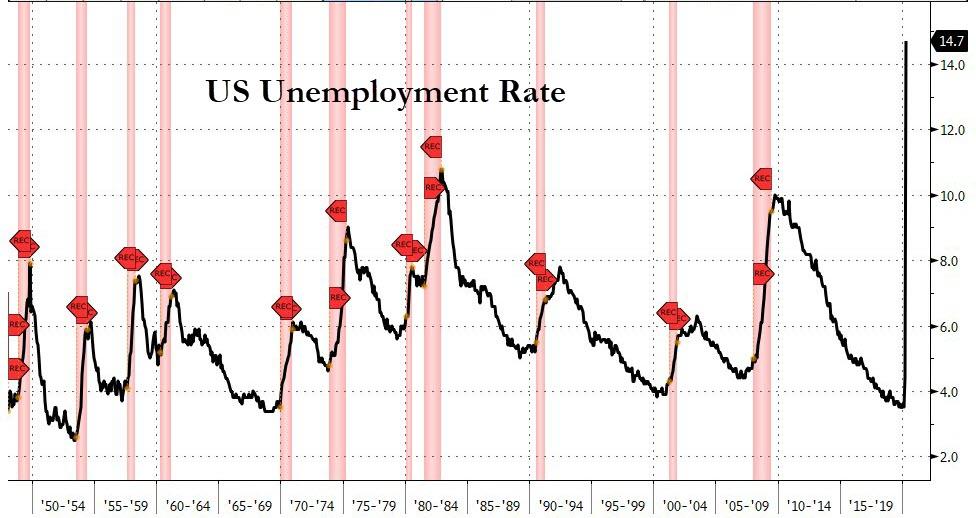
See if this makes sense to you. Today’s data released by the U.S. Labor Department (BLS) showed that we now have the worst unemployment rate since the Great Depression with 14.7%, while 20.5 million are out of work.
As a result, the markets rallied, presumably because the headline number was “less worse” than some estimates for 22 million unemployed. The fact that a broader measure of unemployment, that includes discouraged job seekers and other people on the fringes of the labor market, skyrocketed to a record 22.8%, was conveniently ignored. Wow, I am not making this up.
ZeroHedge added that this drop in unemployment is the biggest in history, and 10 times more than the 2 million jobs lost at the peak of the Great Depression.
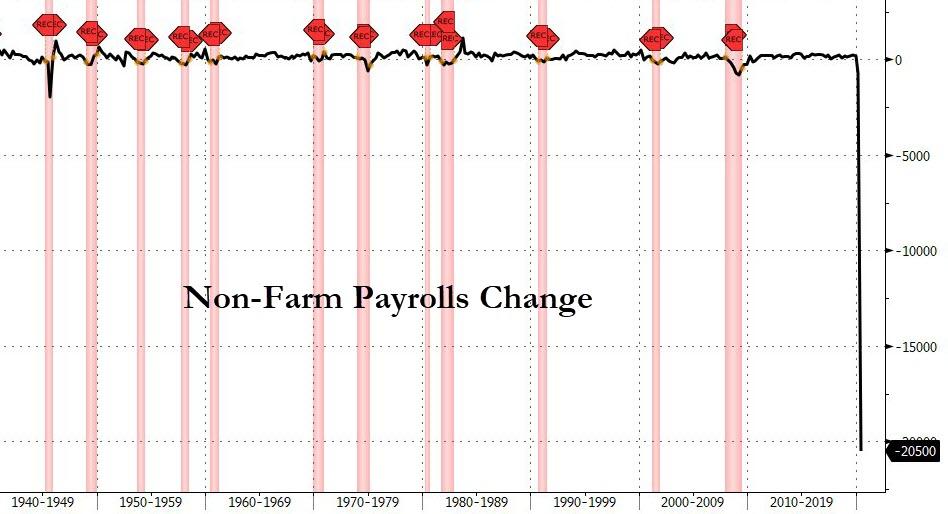
Some clarification from the BLS:
Due to the impact of the COVID-19 pandemic, the relationship between the two was no longer stable in April. Therefore, the establishment survey made modifications to the birth-death model.
If the workers who were recorded as employed but absent from work due to “other reasons” (over and above the number absent for other reasons in a typical April) had been classified as unemployed on temporary layoff, the overall unemployment rate would have been almost 5 percentage points higher than reported (on a not seasonally adjusted basis).
In other words, the real unemployment rate is about 20%!
Since most of the above was generally as expected, the headline-scanning computer algos simply discounted this surreal economic weakness in view of some progress made towards the reopening of seized-up economies not just here but abroad as well, despite an only gradual loosening of restrictions. As if we could flip a switch and all be back to normal…
Even Morgan Stanley’s base bull scenario adds another year to the recovery, while the bear case sees double-digit unemployment into 2022 an onward—and that is assuming there is no second round of closures in late 2020.
With 52% of small businesses expecting to be “out of business” within 6 months, there will be no quick recovery, let alone a V-shaped one. I doubt that this has been priced in the markets.
In the meantime, the bear market rebound rocks on, but it remains to be seen if it has enough momentum to push our Trend Tracking Indexes (TTIs) back into bullish territory.
2. ETFs in the Spotlight
In case you missed the announcement and description of this section, you can read it here again.
It features some of the 10 broadly diversified domestic and sector ETFs from my HighVolume list as posted every Saturday. Furthermore, they are screened for the lowest MaxDD% number meaning they have been showing better resistance to temporary sell offs than all others over the past year.
The below table simply demonstrates the magnitude with which these ETFs are fluctuating above or below their respective individual trend lines (%+/-M/A). A break below, represented by a negative number, shows weakness, while a break above, represented by a positive percentage, shows strength.
For hundreds of ETF choices, be sure to reference Thursday’s StatSheet.
For this past domestic “Buy” cycle, which ended on 2/27/2020, here’s how some our candidates have fared:
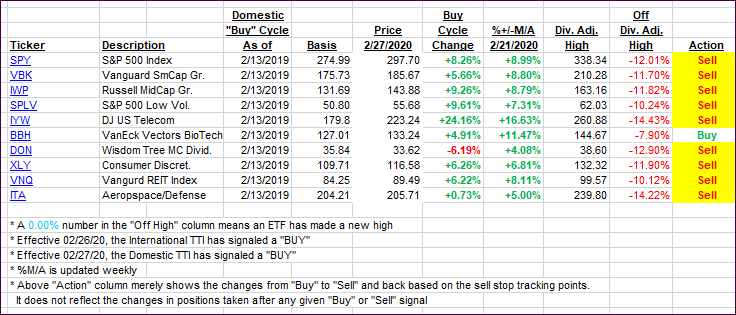
Click image to enlarge
Again, the %+/-M/A column above shows the position of the various ETFs in relation to their respective long-term trend lines, while the trailing sell stops are being tracked in the “Off High” column. The “Action” column will signal a “Sell” once the -8% point has been taken out in the “Off High” column. For more volatile sector ETFs, the trigger point is -10%.
3. Trend Tracking Indexes (TTIs)
Our TTIs rallied with the major indexes, despite the most horrific econ data in history.
This is how we closed 05/08/2020:
Domestic TTI: -8.28% below its M/A (prior close -10.90%)—Sell signal effective 02/27/2020
International TTI: -11.28% below its M/A (prior close -12.96%)—Sell signal effective 02/26/2020
Disclosure: I am obliged to inform you that I, as well as my advisory clients, own some of the ETFs listed in the above table. Furthermore, they do not represent a specific investment recommendation for you, they merely show which ETFs from the universe I track are falling within the specified guidelines.
———————————————————-
WOULD YOU LIKE TO HAVE YOUR INVESTMENTS PROFESSIONALLY MANAGED?
Do you have the time to follow our investment plans yourself? If you are a busy professional who would like to have his portfolio managed using our methodology, please contact me directly or get more details here.
———————————————————
Back issues of the ETF Tracker are available on the web.
Contact Ulli