
ETF Tracker StatSheet
You can view the latest version here.
STARTING MAY ON A SOUR NOTE
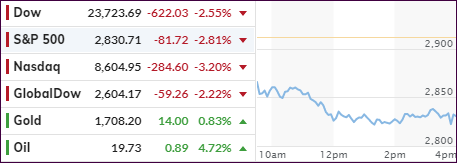
- Moving the markets
Some reality struck the markets today, as big tech earnings disappointed and Trump threatened to pick up the tariff war with China again, supposedly for its poor handling on the Covid-19 pandemic.
While MSM is still buzzed about last months Fed assisted rebound in equities, keep in mind that the S&P 500’s April +12.6% gain was preceded by a loss of -12.5% in March with those two months ending in a draw. Coincidence? Be that as it may, the markets need to gain another 7.2% to get to the level we sold at on 2/27/20.
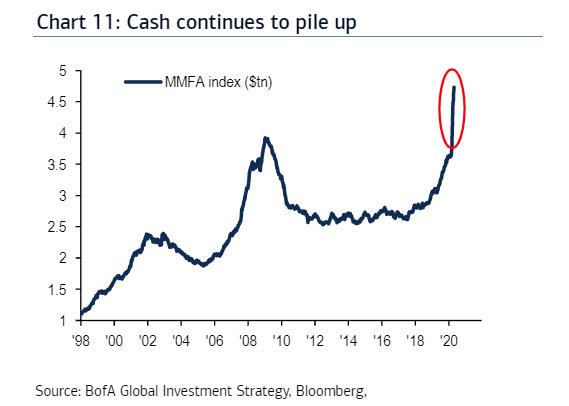
As ZH reported, it’s interesting to note that while algos and quants were busy buying equities hand over fist, human and hedge fund investors continue to sell, as the assets held in money market accounts spiked.
Added BofA’s Hartnett:
“BofA’s private clients have reverted to equity ‘sellers into strength’ in the past 3 weeks…indeed past 2 years in 49 of 69 weeks S&P 500 has exceeded 2800 level private clients have been sellers.”
He further noted:
“Wall St always undershoots and overshoots…most plausible reason overshoot continues is that US policy makers have stimulated more in 10 past weeks than Japan has in 30 years and US real estate/banking/consumer data turns out not to be Japanese.”
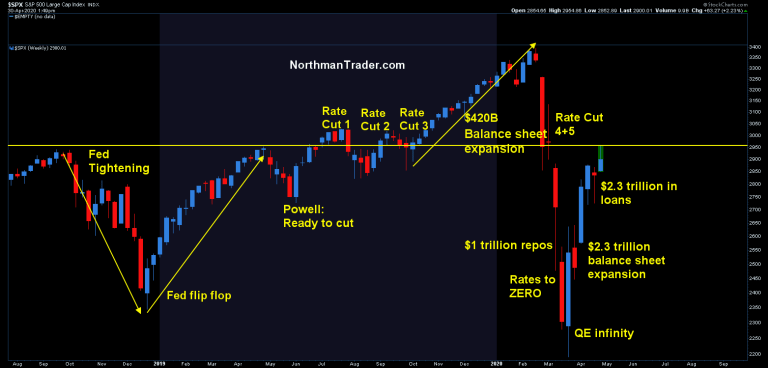
And leave it to technical analyst Sven Henrich to lay out the details:
“The market is a follow the Fed machine long trained to jump back into equities at any sign of Fed action jawboning and promises. It’s no accident that “don’t fight the Fed” is popular mantra. It’s the very proof that market participants know that the Fed is in effect targeting asset prices. Just look at the past year and a half in this chart.”
Not helping the sour mood on Wall Street was a US Manufacturing Survey showing a record collapse in output, Orders and Jobs.
We are now seeking the biggest two-day drop since the March collapse, and the early weekly gain has now evaporated. Does that mean we are on track validating the adage “sell in May and go away?”
It’s a bit early for that but come next week, all trading rooms around the world will be fully staffed again after today’s Mayday Holiday, and we’ll find out whether the bulls can regain the lost momentum of the past couple of days.
2. ETFs in the Spotlight
In case you missed the announcement and description of this section, you can read it here again.
It features some of the 10 broadly diversified domestic and sector ETFs from my HighVolume list as posted every Saturday. Furthermore, they are screened for the lowest MaxDD% number meaning they have been showing better resistance to temporary sell offs than all others over the past year.
The below table simply demonstrates the magnitude with which these ETFs are fluctuating above or below their respective individual trend lines (%+/-M/A). A break below, represented by a negative number, shows weakness, while a break above, represented by a positive percentage, shows strength.
For hundreds of ETF choices, be sure to reference Thursday’s StatSheet.
For this past domestic “Buy” cycle, which ended on 2/27/2020, here’s how some our candidates have fared:
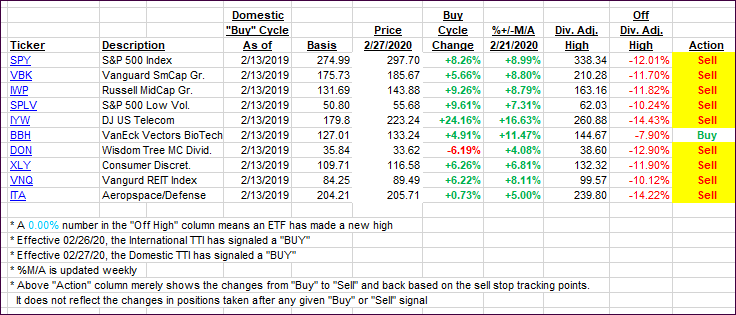
Click image to enlarge
Again, the %+/-M/A column above shows the position of the various ETFs in relation to their respective long-term trend lines, while the trailing sell stops are being tracked in the “Off High” column. The “Action” column will signal a “Sell” once the -8% point has been taken out in the “Off High” column. For more volatile sector ETFs, the trigger point is -10%.
3. Trend Tracking Indexes (TTIs)
Our TTIs headed deeper into bearish territory as the markets experienced its own version of mayday on May day.
This is how we closed 05/01/2020:
Domestic TTI: -11.66% below its M/A (prior close -6.20%)—Sell signal effective 02/27/2020
International TTI: -12.64% below its M/A (prior close -10.10%)—Sell signal effective 02/26/2020
Disclosure: I am obliged to inform you that I, as well as my advisory clients, own some of the ETFs listed in the above table. Furthermore, they do not represent a specific investment recommendation for you, they merely show which ETFs from the universe I track are falling within the specified guidelines.
———————————————————-
WOULD YOU LIKE TO HAVE YOUR INVESTMENTS PROFESSIONALLY MANAGED?
Do you have the time to follow our investment plans yourself? If you are a busy professional who would like to have his portfolio managed using our methodology, please contact me directly or get more details here.
———————————————————
Back issues of the ETF Tracker are available on the web.
Contact Ulli