
- Moving the markets
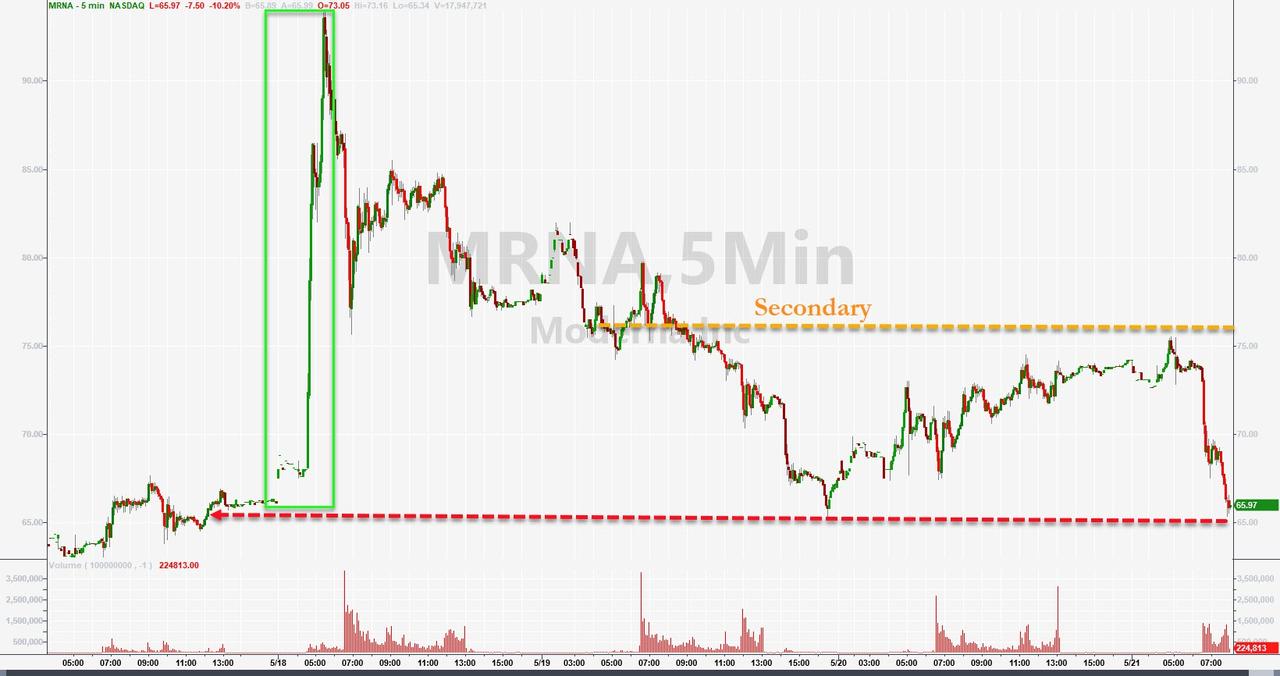
Sometimes you just have to laugh at some of the market idiocy. Today, we had such a moment when Moderna (MRNA), who issued a press release on Monday, which I discussed, as to how 8 healthy young people did not die when given their latest vaccine.
The obvious stock pump turned into a giant dump today and putting all buyers of the hyped secondary offering under water, as this chart by ZH shows. You think there will be class-action lawsuits?
Added Linette Lopez from Business Insider:
It’s a perfect storm of stupid in the stock market right now.
I can’t wait to see which company will be next in line to promote the latest and greatest for the coronavirus treatment without producing any scientific evidence…
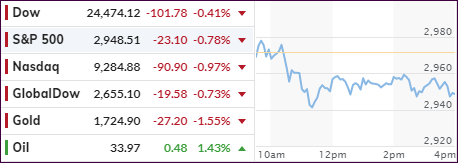
The indexes bounced below their respective unchanged lines throughout the session and scored only minor losses, despite horrific economic data points.
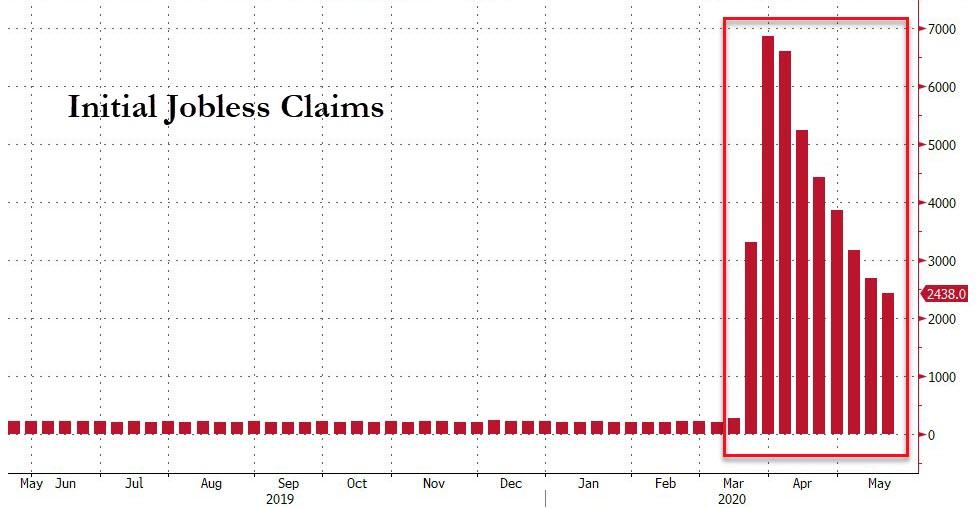
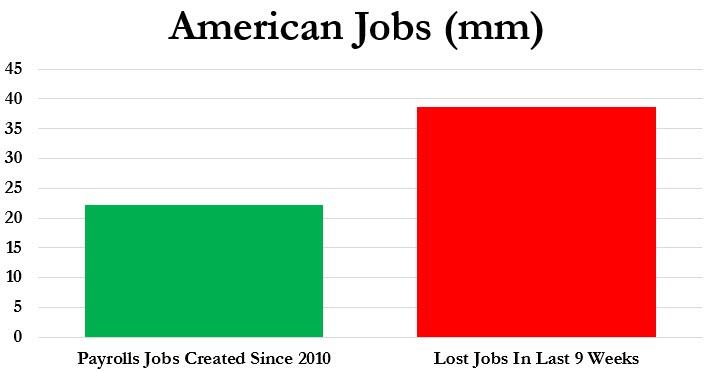
Another 2.44 million filed for unemployment last week, which was slightly worse than the 2.4 million expected. That brings the nine-week total now to 38.64 million jobless, which is massively worse, as ZH put it, than the prior worst nine-week period in the past 50+ years.
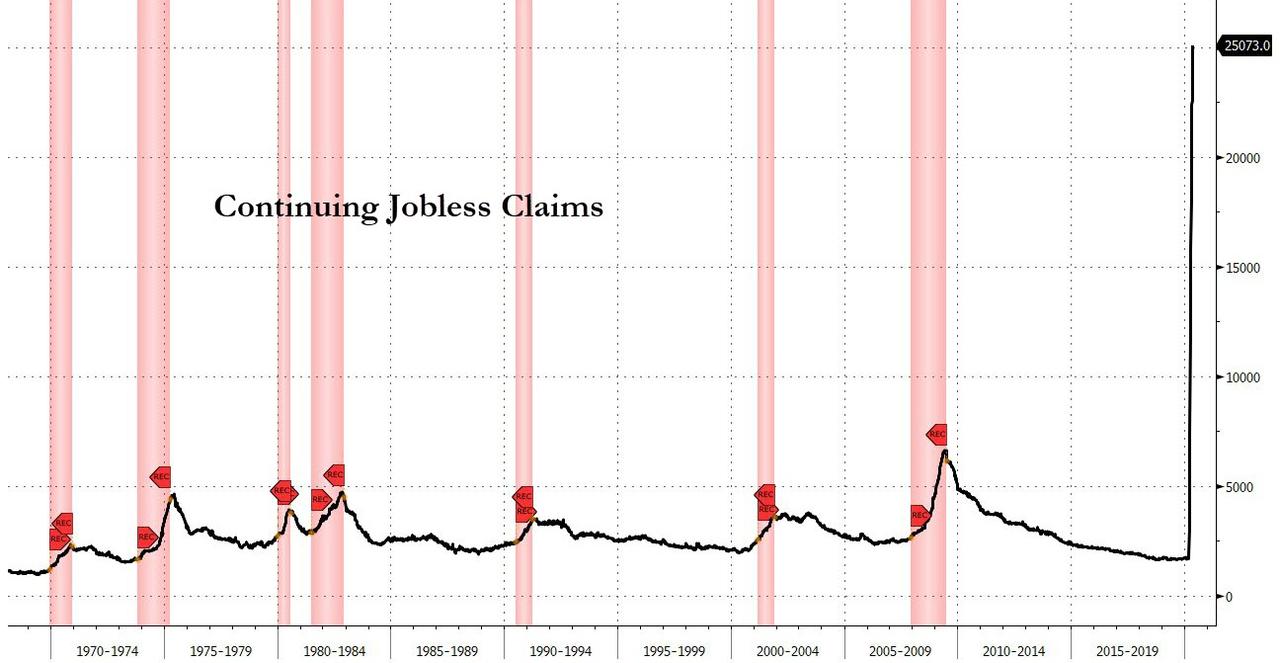
As a result, we are now seeing the highest level of continuing claims ever. But what’s even more devastating is that far more Americans have filed for unemployment than jobs gained during the last decade since the end of the Great Recession.
But, as disgusting as this picture truly is, the markets took it in stride with the S&P only dropping some -0.75%, and I am sure a new rally is being prepared and lurking on the horizon. Given that, it almost seems not even noteworthy that Existing Home Sales collapsed to 9-year lows, while China tensions soared.
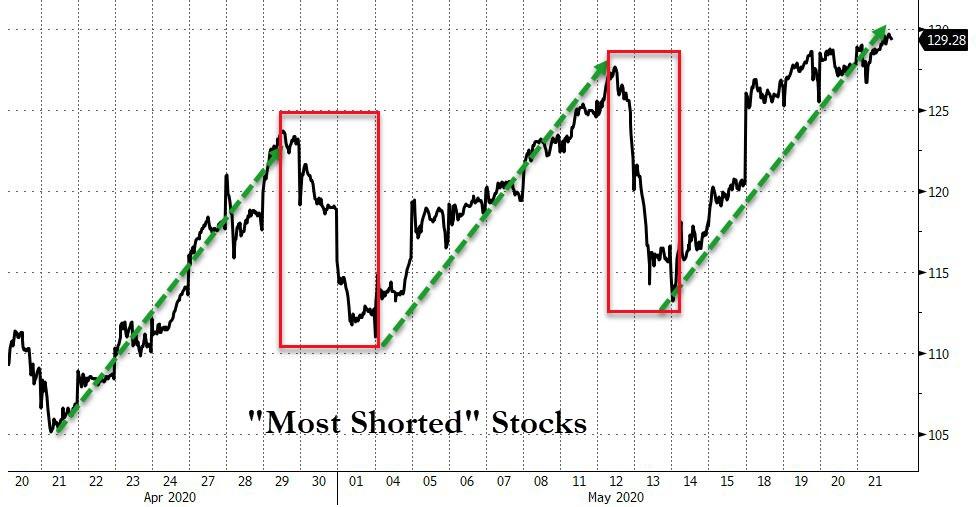
Keeping the bullish dream alive was another giant short squeeze, which prevented a thorough thrashing of the indexes, although it was not enough of an effort to assure a green close.
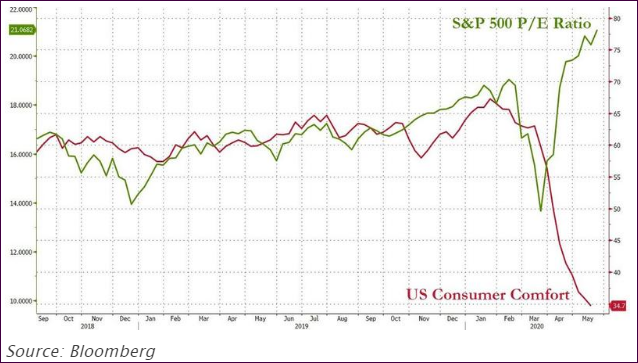
Zero Hege concluded that “whatever the Fed, the market and the politicians are doing…it’s not working for sentiment:”
2. ETFs in the Spotlight
In case you missed the announcement and description of this section, you can read it here again.
It features some of the 10 broadly diversified domestic and sector ETFs from my HighVolume list as posted every Saturday. Furthermore, they are screened for the lowest MaxDD% number meaning they have been showing better resistance to temporary sell offs than all others over the past year.
The below table simply demonstrates the magnitude with which these ETFs are fluctuating above or below their respective individual trend lines (%+/-M/A). A break below, represented by a negative number, shows weakness, while a break above, represented by a positive percentage, shows strength.
For hundreds of ETF choices, be sure to reference Thursday’s StatSheet.
For this past domestic “Buy” cycle, which ended on 2/27/2020, here’s how some our candidates have fared:
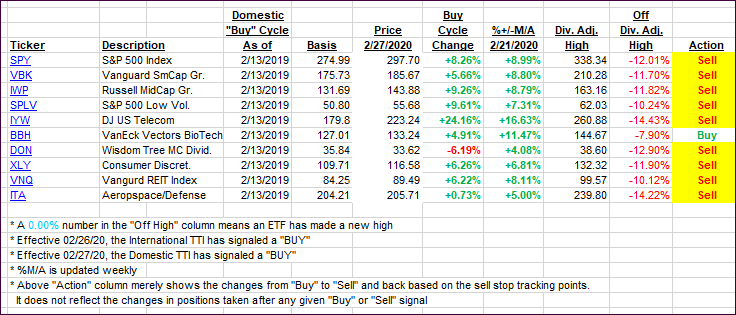
Click image to enlarge
Again, the %+/-M/A column above shows the position of the various ETFs in relation to their respective long-term trend lines, while the trailing sell stops are being tracked in the “Off High” column. The “Action” column will signal a “Sell” once the -8% point has been taken out in the “Off High” column. For more volatile sector ETFs, the trigger point is -10%.
3. Trend Tracking Indexes (TTIs)
Our TTIs change only slightly as the major indexes trod water all day.
This is how we closed 05/21/2020:
Domestic TTI: -7.85% below its M/A (prior close -7.44%)—Sell signal effective 02/27/2020
International TTI: -10.39% below its M/A (prior close -9.78%)—Sell signal effective 02/26/2020
Disclosure: I am obliged to inform you that I, as well as my advisory clients, own some of the ETFs listed in the above table. Furthermore, they do not represent a specific investment recommendation for you, they merely show which ETFs from the universe I track are falling within the specified guidelines.
Contact Ulli