
- Moving the markets
Bullish sentiment got an early boost this morning after Gilead Sciences reported that a government clinical trial, designed to evaluate its experimental drug remdesivir in Covid-19 patients, had met the study’s main goal. Hopes were high for progress towards a successful treatment.
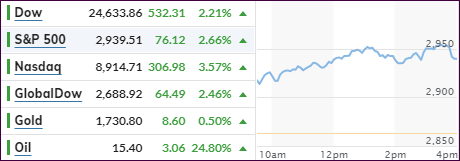
That news was good for an initial 350-point jump in the Dow and clearly overrode the potential bearish impact from horrific economic numbers:
Consumer spending fell -7.6% in the first quarter.
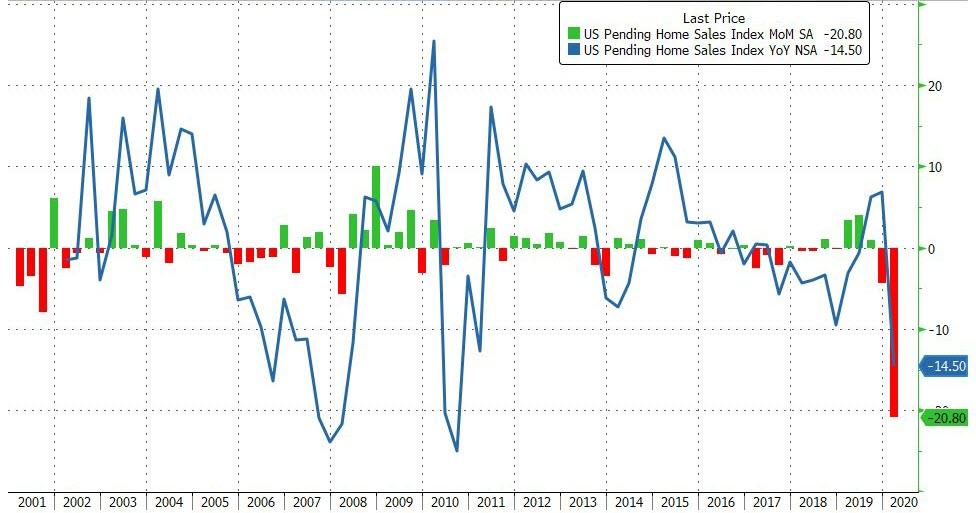
Pending Home Sales plummeted by a record in March to the lowest level since 2011.
Quarter 1 GDP plunges -4.8%, its biggest drop since the financial crises 10 years ago
Boeing burns through a record $4.7 billion in cash, revenue crashes 26%, 10% of workforce will be laid off
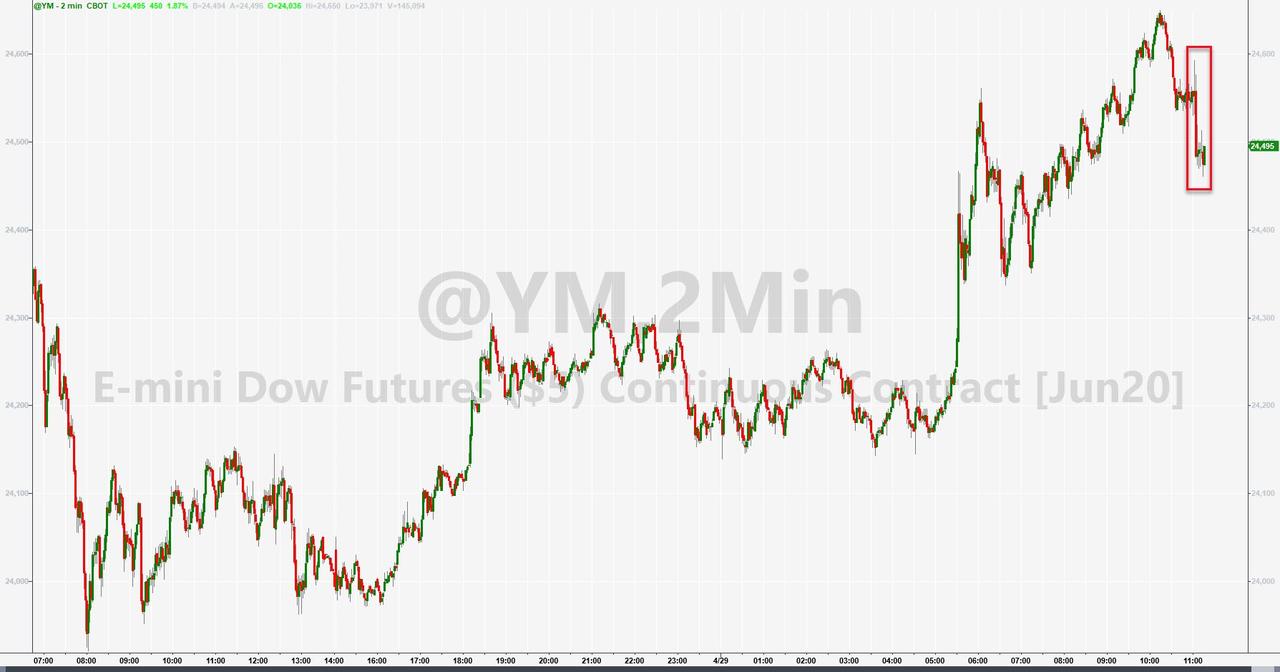
None of this mattered, as the bullish path had been set with Fed chief Powell committing to take strong action in order to support the economy and the markets by exuding an aura of confidence in the face of many unknowns.
After Powell’s initial announcement, stocks, the dollar and bonds dropped but managed to regain traction into the close. During his press conference he uttered the words I never thought I would hear:
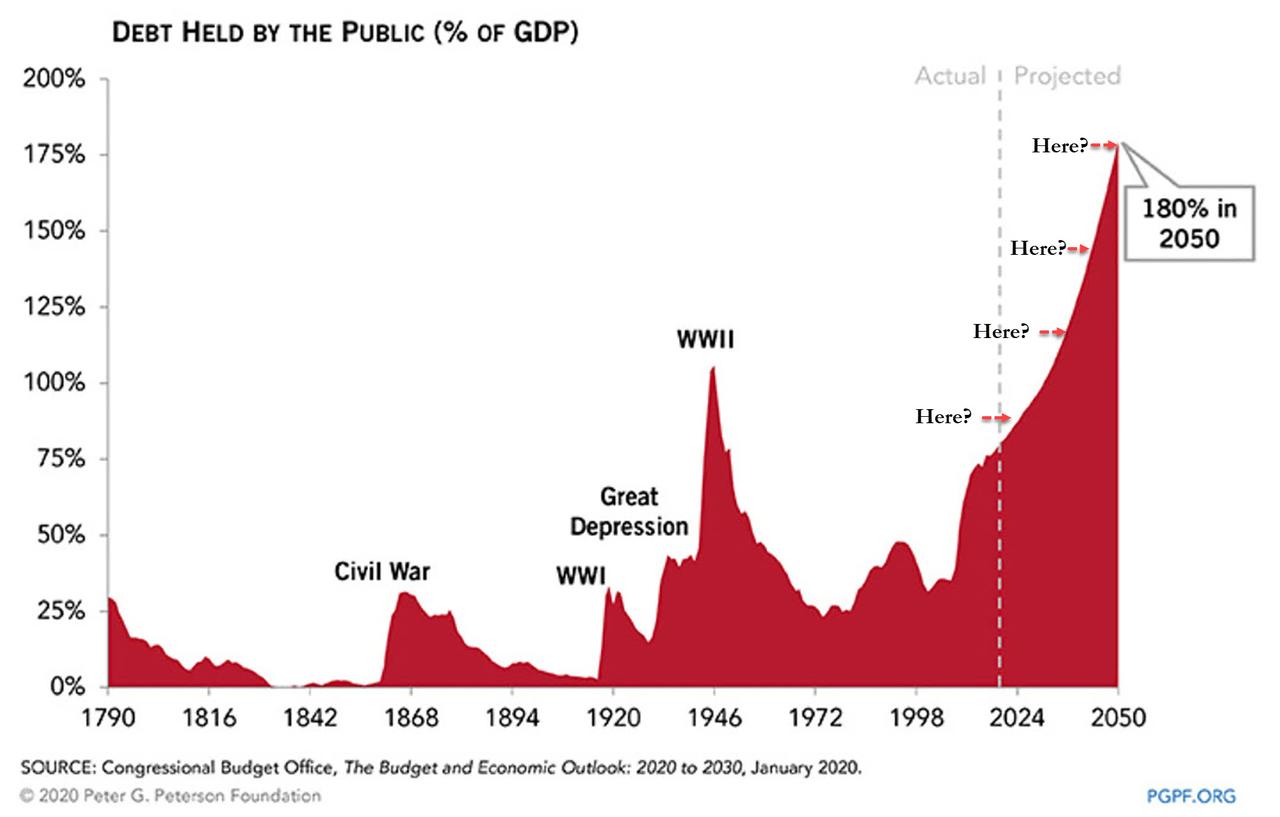
“The debt is growing faster than the economy. This is not the time to act upon those concerns”
Huh? Just as was pondering as to what moment in time we should be concerned about the excessive debt creation, ZeroHedge had already managed to come up with several possible answers via this chart.
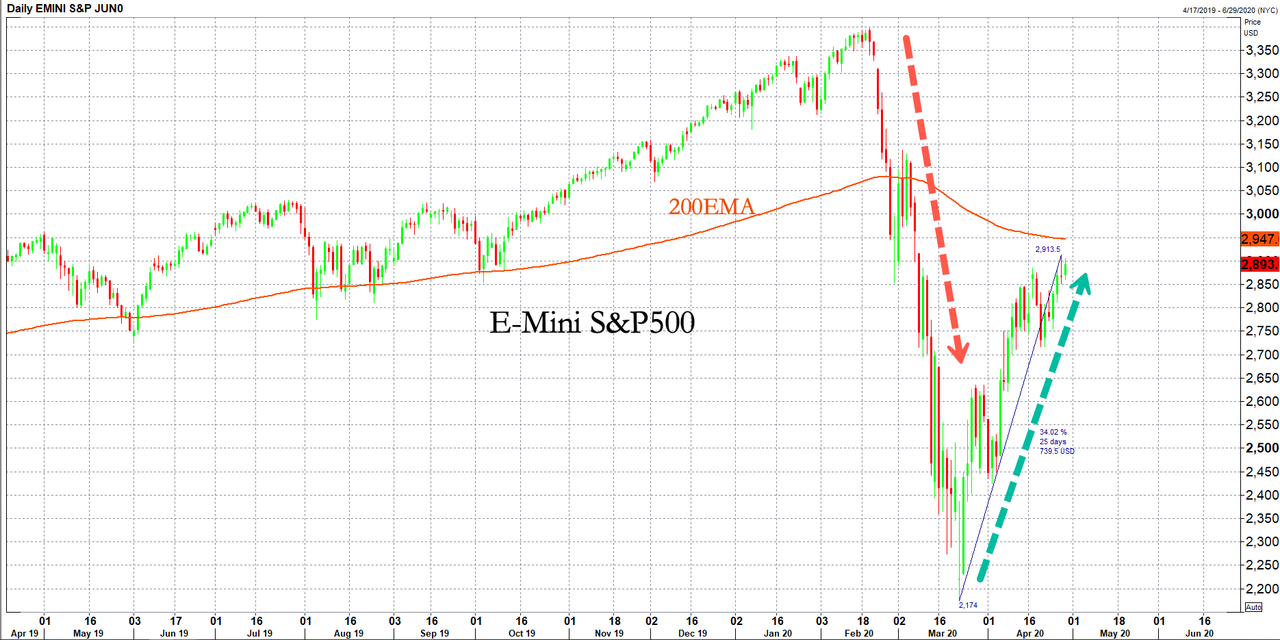
Although stocks have staged an amazing Fed assisted recovery since the lows in March, the Dow remains down some 15% YTD, but there is still one trading day left.
Some of the big hedge fund investors think the market rally in April has gone to extremes, while a survey showed that 16% are still saying the latest move was a bear market rally and further downside was ahead.
Rounding out the discussion was ZeroHedge with this observation:
“Of course, you don’t need to be a wealthy UBS client to understand there is a deep disconnect between the market and the real economy. Main street America has been wiped out, with approximately 30 million job losses in the past 6 weeks alone. And a new shocking report on Monday showed perhaps 50 million people have lost their jobs in the pandemic. Nevertheless, the Fed and Trump admin continue pumping record amounts of stimulus and bailout money to revive corporate America and Wall Street speculators.
If the economy doesn’t improve, meaning a V-shaped recovery is not seen and more of a U-shaped or L-shaped, it would suggest stocks have a long way to drop, likely resulting in the Fed panic buying stocks.”
In the meantime, our Trend Tracking Indexes (section 3) have improved greatly and, if the month of May does not follow the adage “sell in May and go away,” we might be seeing a new domestic “Buy” signal in the not too distant future.
2. ETFs in the Spotlight
In case you missed the announcement and description of this section, you can read it here again.
It features some of the 10 broadly diversified domestic and sector ETFs from my HighVolume list as posted every Saturday. Furthermore, they are screened for the lowest MaxDD% number meaning they have been showing better resistance to temporary sell offs than all others over the past year.
The below table simply demonstrates the magnitude with which these ETFs are fluctuating above or below their respective individual trend lines (%+/-M/A). A break below, represented by a negative number, shows weakness, while a break above, represented by a positive percentage, shows strength.
For hundreds of ETF choices, be sure to reference Thursday’s StatSheet.
For this past domestic “Buy” cycle, which ended on 2/27/2020, here’s how some our candidates have fared:
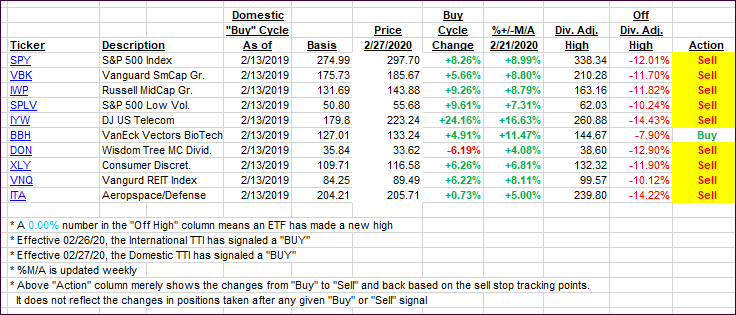
Click image to enlarge
Again, the %+/-M/A column above shows the position of the various ETFs in relation to their respective long-term trend lines, while the trailing sell stops are being tracked in the “Off High” column. The “Action” column will signal a “Sell” once the -8% point has been taken out in the “Off High” column. For more volatile sector ETFs, the trigger point is -10%.
3. Trend Tracking Indexes (TTIs)
Our TTIs again headed closer to their respective trend lines with the Domestic one being closer to a new potential “Buy” signal.
This is how we closed 04/29/2020:
Domestic TTI: -6.20% below its M/A (prior close -9.34%)—Sell signal effective 02/27/2020
International TTI: -10.10% below its M/A (prior close -12.25%)—Sell signal effective 02/26/2020
Disclosure: I am obliged to inform you that I, as well as my advisory clients, own some of the ETFs listed in the above table. Furthermore, they do not represent a specific investment recommendation for you, they merely show which ETFs from the universe I track are falling within the specified guidelines.
Contact Ulli