
ETF Tracker StatSheet
You can view the latest version here.
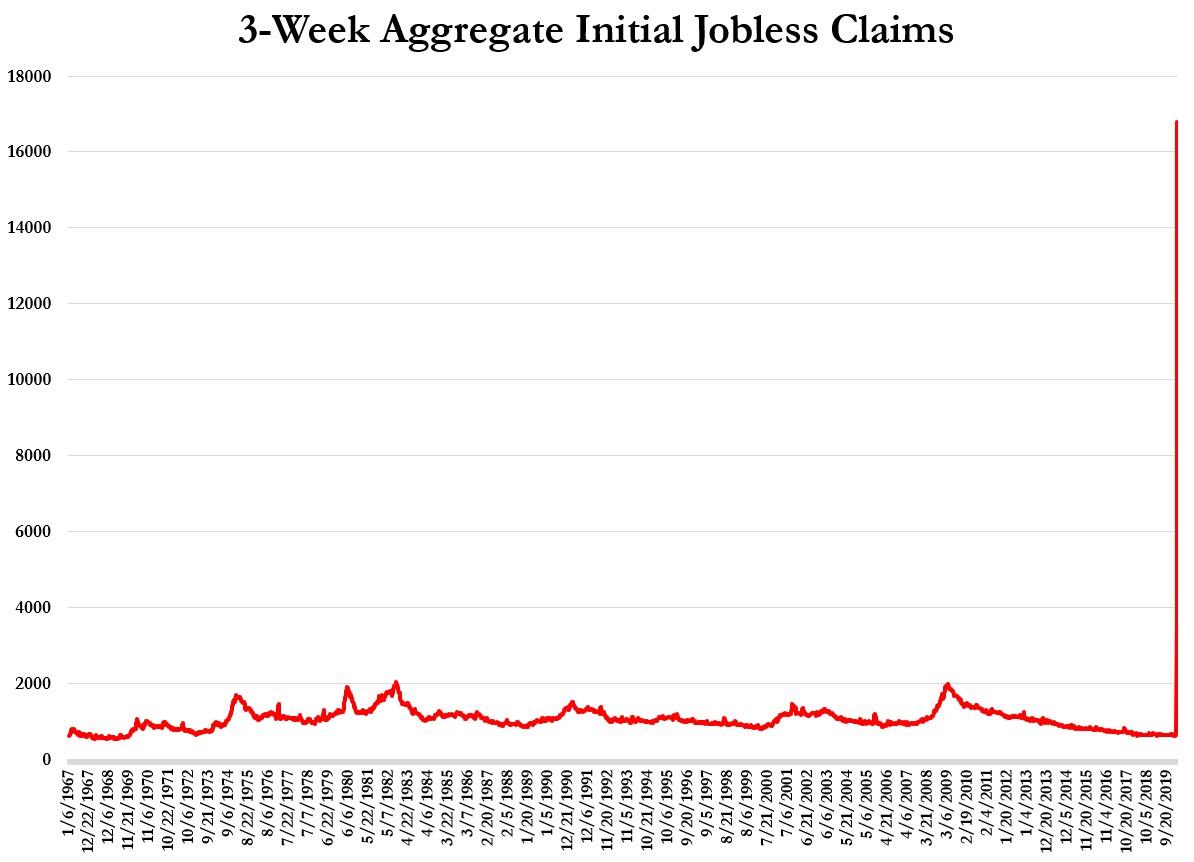
Jobless Claims Surge To 17 Million—Markets Rally
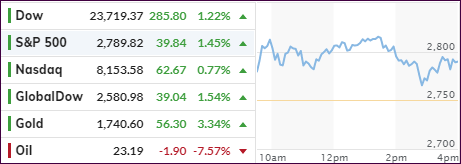
- Moving the markets
The shocking yet not surprising number of the day was the fact that now almost 17 million people have filed initial jobless claims—in the past 3 weeks, which implies an unemployment rate of around 13% or so, surpassing the 10% reached during the last recession.
As
far as the markets are concerned, this bad news was more than offset by the allegedly
good news when Fed head Powell told the world, “There’s Really No Limit
On What the Fed Can Do.”
ZeroHedge summed it up like this:
The Federal Reserve announced its latest series of sweeping, unprecedented action to backstop the credit pillars supporting the entire economy and provide as much as $2.3 trillion in additional loans during the coronavirus pandemic, including starting programs to aid small and mid-sized businesses as well as state and local governments: “The funding will assist households and employers of all sizes and bolster the ability of state and local governments to deliver critical services during the coronavirus pandemic.”
Subsequently, it came as no surprise that, as some analysts had expected, the Fed would start buying junk bonds including junk ETFs like JNK which, as a result, exploded some 7% higher.
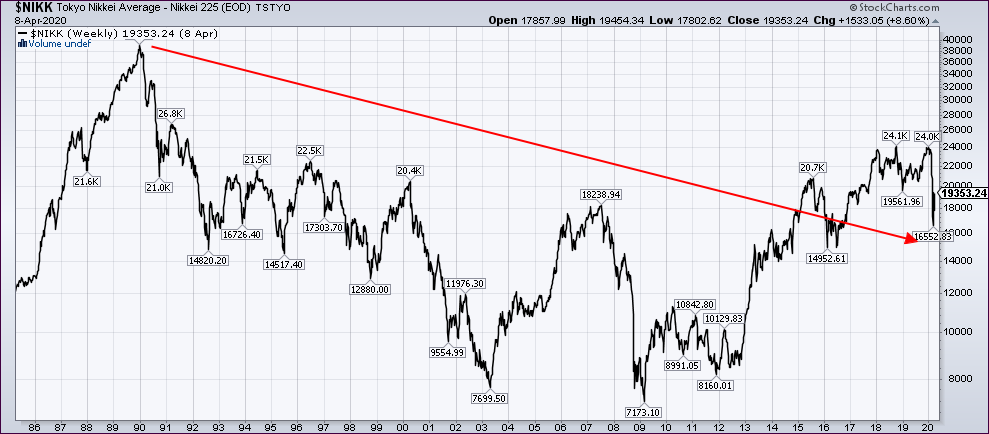
Now there is only one thing left for the Fed to buy, and that is stocks and everything else that needs propping up. Once that happens, free markets will have died, and we will follow the path of Japan, where the high from 30 years ago was never taken out, as this Nikkei chart shows.
Not to be outdone, the UK has taken this scheme one step further, as the BOE (Bank of England) became the first Central Bank to openly fund the deficit by announcing that “it will begin to finance the short-term needs of the Treasury.” In other words, it will directly monetize the UK deficit, something central banks had—for the past decade—denied they do or would do.
At this time, I still question that this current massive rebound represents the end of the bear market, since there have been 38 other historical occasions where markets rallied just as much or more. However, on average, the final bear market low came 137 days after registering such a loss. If that would repeat, August 7 would be the projected low. Hat tip goes to Mark Hulbert for this data.
Nevertheless, this week was a good one for those trying to recover losses with the S&P 500 being pumped up an amazing 10%—in four trading days. That is an event which happens only in bear markets.
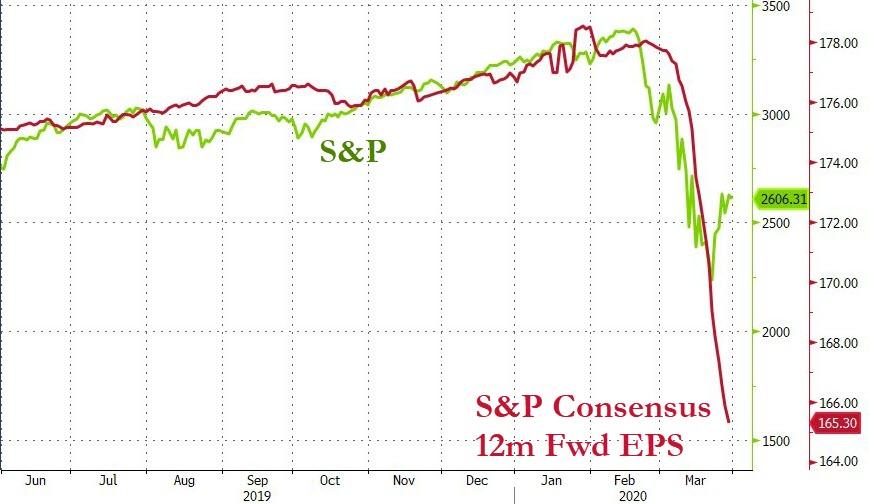
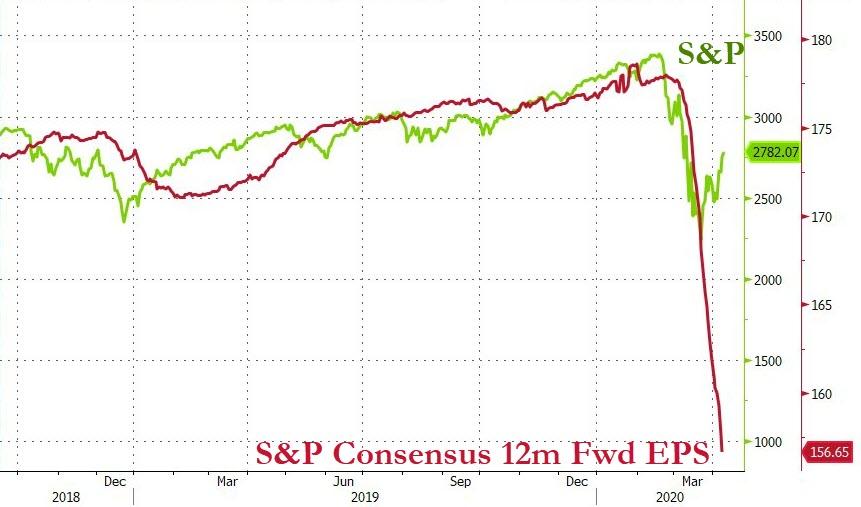
Again, economic realities have severely diverged from market levels. On March 31st, I posted this chart by Bloomberg showing where the S&P 500’s level should be at, given the 12 month consensus on forward earnings (EPS), which was shown to be in the 1,600 area.
Now this chart has been updated, and the fair market value of the S&P has dropped to around 1,000, yet it is currently at 2,790. That’s one of those things that makes me go “Hmmm.”
2. ETFs in the Spotlight
In case you missed the announcement and description of this section, you can read it here again.
It features some of the 10 broadly diversified domestic and sector ETFs from my HighVolume list as posted every Saturday. Furthermore, they are screened for the lowest MaxDD% number meaning they have been showing better resistance to temporary sell offs than all others over the past year.
The below table simply demonstrates the magnitude with which these ETFs are fluctuating above or below their respective individual trend lines (%+/-M/A). A break below, represented by a negative number, shows weakness, while a break above, represented by a positive percentage, shows strength.
For hundreds of ETF choices, be sure to reference Thursday’s StatSheet.
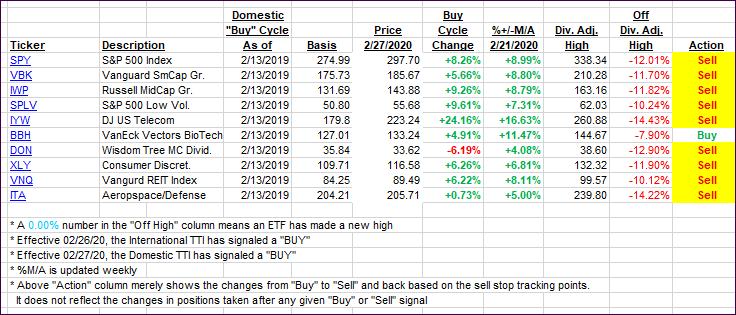
For this past domestic “Buy” cycle, which ended on 2/27/2020, here’s how some our candidates have fared:
Click image to enlarge
Again, the %+/-M/A column above shows the position of the various ETFs in relation to their respective long-term trend lines, while the trailing sell stops are being tracked in the “Off High” column. The “Action” column will signal a “Sell” once the -8% point has been taken out in the “Off High” column. For more volatile sector ETFs, the trigger point is -10%.
In my advisor practice, we may or may not be invested in some of the 10 ETFs listed above.
3. Trend Tracking Indexes (TTIs)
Our TTIs improved again, as the rally continued in the face of poor economic data.
Here’s how we closed 04/09/2020:
Domestic TTI: -12.98% below its M/A (prior close -15.26%)—Sell signal effective 02/27/2020
International TTI: -14.46% below its M/A (prior close -16.18%)—Sell signal effective 02/26/2020
Disclosure: I am obliged to inform you that I, as well as my advisory clients, own some of the ETFs listed in the above table. Furthermore, they do not represent a specific investment recommendation for you, they merely show which ETFs from the universe I track are falling within the specified guidelines.
———————————————————-
WOULD YOU LIKE TO HAVE YOUR INVESTMENTS PROFESSIONALLY MANAGED?
Do you have the time to follow our investment plans yourself? If you are a busy professional who would like to have his portfolio managed using our methodology, please contact me directly or get more details here.
———————————————————
Back issues of the ETF Tracker are available on the web.
Contact Ulli