
- Moving the markets
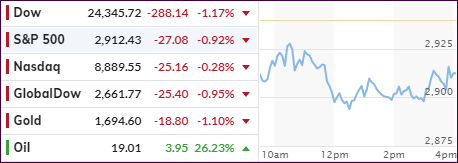
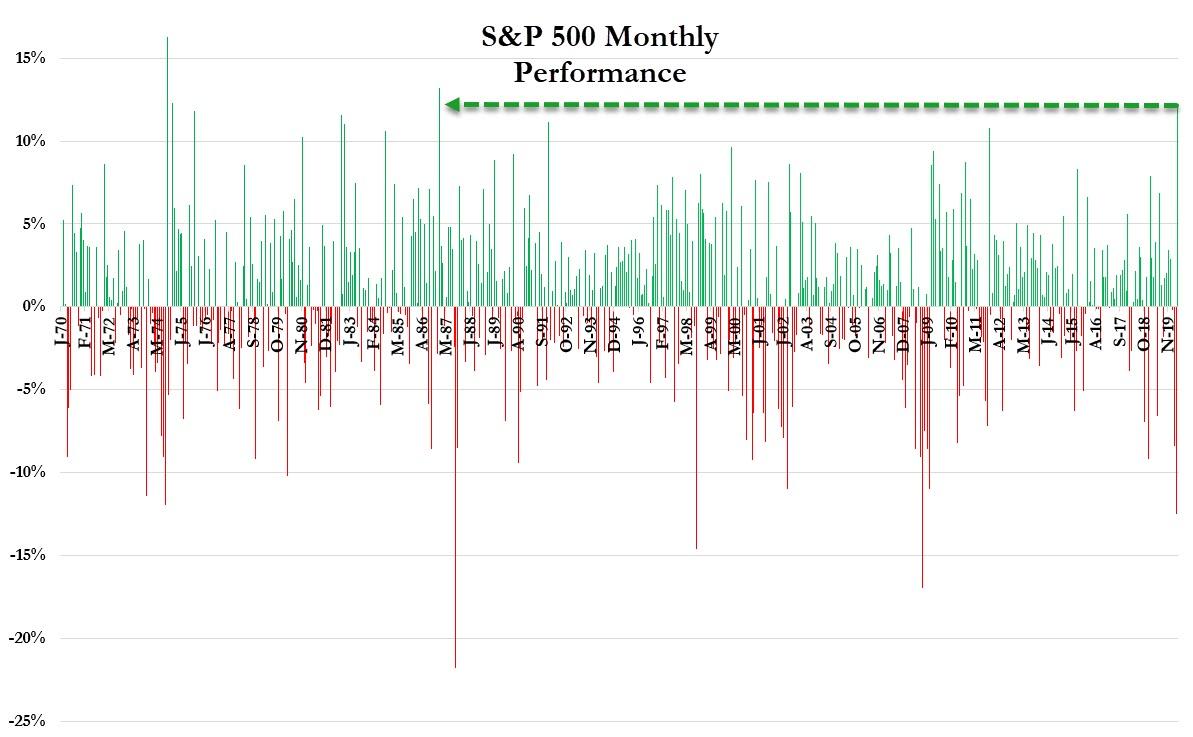
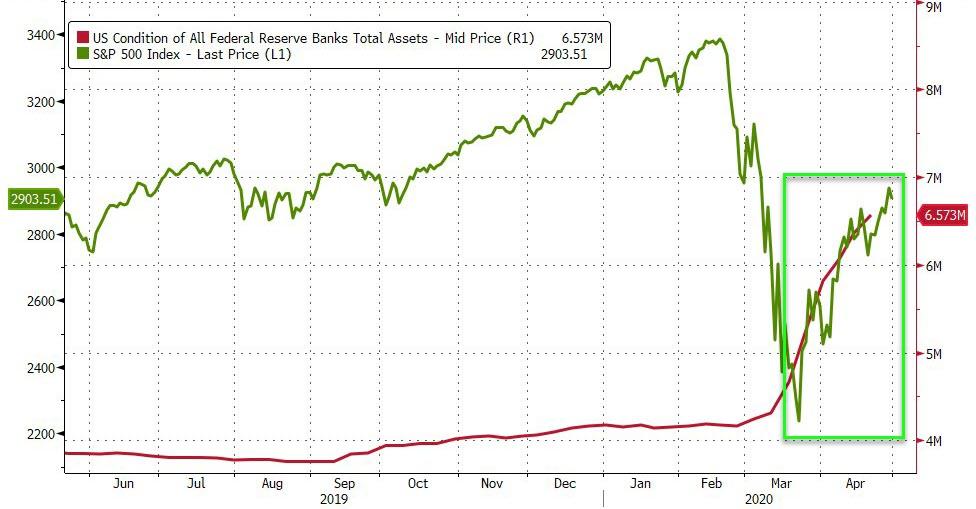
After rallying all month, the major indexes stalled today, but were able to wipe out most of March’s losses for the buy-and-hold crowd with the S&P 500 sporting its best monthly return since 1987. Of course, as we know, the rebound was entirely based on Fed support, as the markets were swamped with liquidity. As a buy-and-holder, you should give thanks to the Fed’s largesse; next time you may not be as fortunate.
Analyst Marc Lasry confirmed in a CNBC interview what I have been saying for a long time:
“None of this [equity rally] is based on fundamentals, this is all about what the Fed is doing… and sooner or later reality will reassert itself.”
Joining in the chorus of reality was economist Jim Bianco:
“I understand the market has been up a lot since the March low. But what I see in the market is a retracement rally that looks very similar to the first type of rallies that you get in protracted bear markets.”
After which he added:
“We’ll revisit the 2,200 S&P low, if not make a lower low – probably by late summer.”
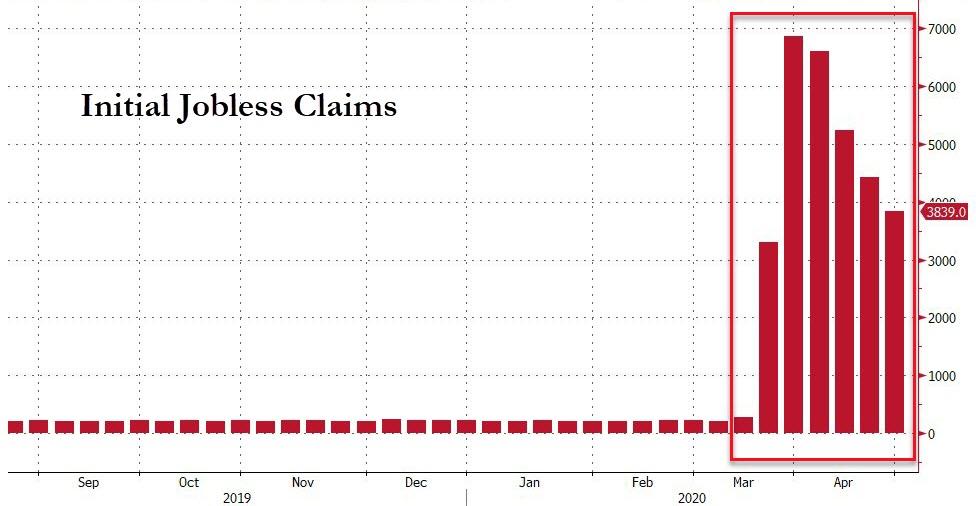
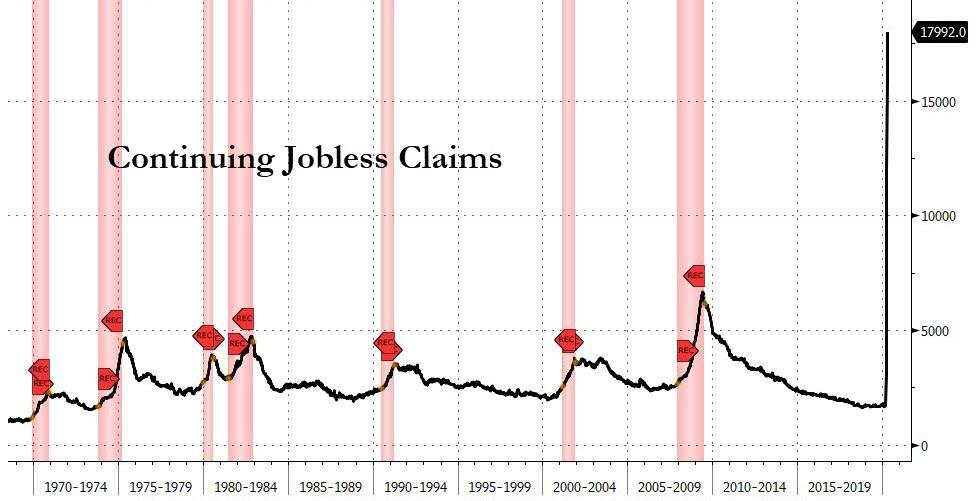
The economic conditions continue to worsen, as another 3.839 million Americans have field for unemployment benefits for the first time bringing the six-week total to 30.31 million which, according to ZeroHedge, is over 12 times the prior worst five-week period in the last 50-plus years. And, of course, the continuing claims are shooting up as well.
Consumer spending followed suit, as its spending collapsed by a record -7.3%, its sharpest drop since the first quarter of 1980. On the positive side, the savings rate exploded from 8% to 13.1% of disposable income, indicating, that consumers are starting to “live within their means.”
In the end, the mission was accomplished leaving me pondering if the adage “sell in May and go away,” still holds true, or will this time really be different?
2. ETFs in the Spotlight
In case you missed the announcement and description of this section, you can read it here again.
It features some of the 10 broadly diversified domestic and sector ETFs from my HighVolume list as posted every Saturday. Furthermore, they are screened for the lowest MaxDD% number meaning they have been showing better resistance to temporary sell offs than all others over the past year.
The below table simply demonstrates the magnitude with which these ETFs are fluctuating above or below their respective individual trend lines (%+/-M/A). A break below, represented by a negative number, shows weakness, while a break above, represented by a positive percentage, shows strength.
For hundreds of ETF choices, be sure to reference Thursday’s StatSheet.
For this past domestic “Buy” cycle, which ended on 2/27/2020, here’s how some our candidates have fared:
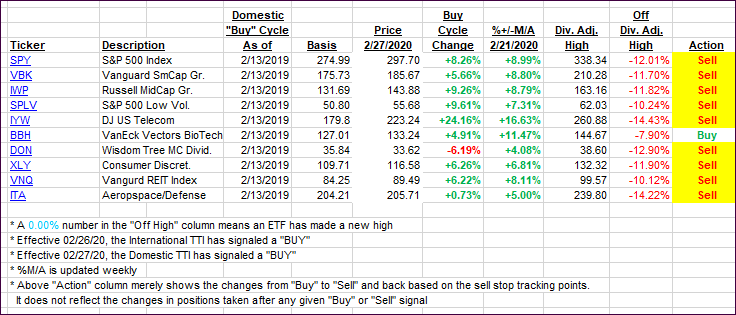
Click image to enlarge
Again, the %+/-M/A column above shows the position of the various ETFs in relation to their respective long-term trend lines, while the trailing sell stops are being tracked in the “Off High” column. The “Action” column will signal a “Sell” once the -8% point has been taken out in the “Off High” column. For more volatile sector ETFs, the trigger point is -10%.
3. Trend Tracking Indexes (TTIs)
Our TTIs slipped as the markets struggled and closed modestly in the red.
This is how we closed 04/30/2020:
Domestic TTI: -8.61% below its M/A (prior close -6.20%)—Sell signal effective 02/27/2020
International TTI: -11.02% below its M/A (prior close -10.10%)—Sell signal effective 02/26/2020
Disclosure: I am obliged to inform you that I, as well as my advisory clients, own some of the ETFs listed in the above table. Furthermore, they do not represent a specific investment recommendation for you, they merely show which ETFs from the universe I track are falling within the specified guidelines.
Contact Ulli