
- Moving the markets
Despite the Fed saying that “aggressive action is needed” and subsequently proved it by introducing unlimited QE via purchases of $125 billion in securities every day, the markets managed to swing wildly but only “below” their respective unchanged lines.
Analyst Graham Summers summed it up best:
As I warned two weeks ago, the Fed is going to start buying “everything”… AKA Weimar lite.
The Fed has faced a choice… either let debt deflation clear the bad debts from the system, even if it means major corporations and banks failing, OR start buying “everything” in an effort to prop up the system (even if it induces raging inflation).
Well, the Fed officially crossed the Rubicon over the weekend. Going into the weekend the Fed had already…
1) Cut interest rates from 1.25% to 0.15%.
2) Launched a $1.5 trillion repo program.
3) Launched a $700 billion QE program.
4) Begun buying commercial paper debt instruments.
5) Opened the discount window to the eight largest banks in the US.
6) Expanded the repo program to $1 trillion per day.
7) Opened dollar swaps with international central banks.
8) Opened credit windows to the money market funds market.
9) Begin buying municipal bonds.
Well, buckle up, because over the weekend, the Fed announced it would make its QE program “open ended” meaning it would buy Treasuries and Mortgage Backed Securities as needed.
Put another way, the Fed announced unlimited QE. And to top it off, the Fed ALSO added that it was expanding its QE mandate to buy corporate debt (for the first time in history).
Put another way, the Fed has announced it is going to effectively monetize “everything,”… Treasuries, Mortgage Backed Securities, Municipal debt, Corporate debt, etc. The only thing debt assets left are student debt, auto loans, and credit card debt.
In simple terms, the Everything Bubble burst… and now the Fed is dealing with it by buying EVERYTHING.
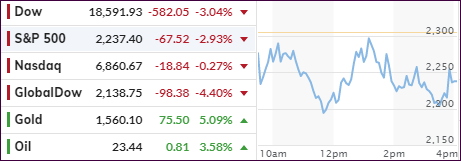
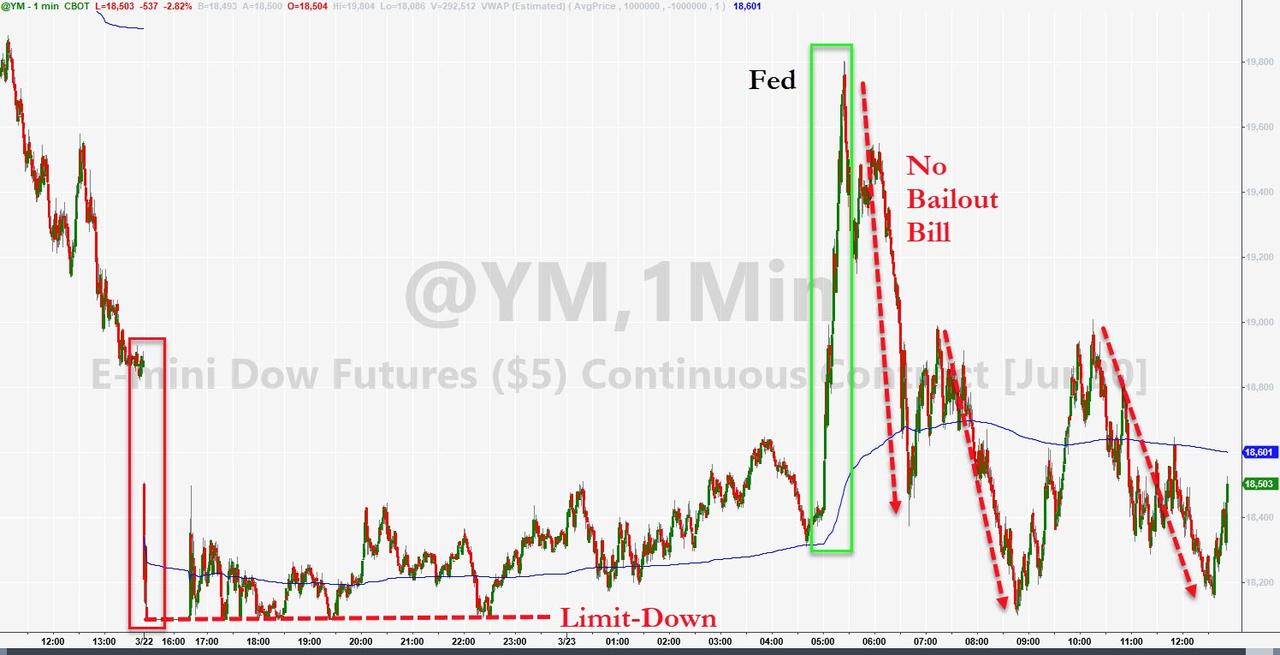
Given all that QEternity effort, the markets tanked anyway with the major indexes declining, but the Nasdaq withstood the brunt of the sell-off best by only slipping -0.27%. Of course, hopes springs eternal that Washington’s divided politicians will eventually come together and offer a rescue package. Whether that will affect the markets positively, or merely elicit another sell-off, remains to be seen.
Still, serious damage has been done and reality struck hard and fast. AS ZH confirms, in mid-February, the Dow was almost up 60% from Trump’s election…and now it’s gone. Joining the Dow are SmallCaps and Transports, which are now in the red since Trump was elected, as this chart demonstrates. So much for the idea of investing without an exit strategy.
Hedge fund manager Scott Minerd, when asked to explain if there is more pain to come, tweeted this:
“How do we know when we have not reached the bottom? When the talking heads on CNBC are buying.”
2. ETFs in the Spotlight
In case you missed the announcement and description of this section, you can again.
It features 10 broadly diversified and sector ETFs from my HighVolume list as posted every Saturday. Furthermore, they are screened for the lowest MaxDD% number meaning they have been showing better resistance to temporary sell offs than all others over the past year.
The below table simply demonstrates the magnitude with which some of the ETFs are fluctuating regarding their positions above or below their respective individual trend lines (%+/-M/A). A break below, represented by a negative number, shows weakness, while a break above, represented by a positive percentage, shows strength.
For hundreds of ETF choices, be sure to reference Thursday’s StatSheet.
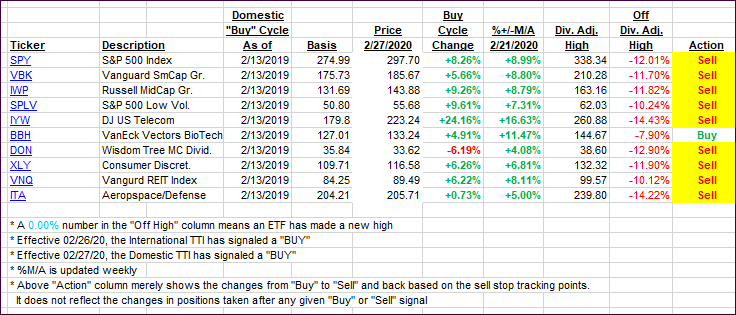
For this past domestic “Buy” cycle, which ended on 2/27/2020, here’s how some our candidates have fared:
Click image to enlarge
Again, the %+/-M/A column above shows the position of the various ETFs in relation to their respective long-term trend lines, while the trailing sell stops are being tracked in the “Off High” column. The “Action” column will signal a “Sell” once the -8% point has been taken out in the “Off High” column. For more volatile sector ETFs, the trigger point is -10%.
3. Trend Tracking Indexes (TTIs)
Our TTIs headed south again and reached the most bearish position below their respective trend lines—ever.
Here’s how we closed 03/23/2020:
Domestic TTI: -34.08% below its M/A (prior close -30.98%)—Sell signal effective 02/27/2020
International TTI: -30.27% below its M/A (prior close -28.11%)—Sell signal effective 02/26/2020
Disclosure: I am obliged to inform you that I, as well as my advisory clients, own some of the ETFs listed in the above table. Furthermore, they do not represent a specific investment recommendation for you, they merely show which ETFs from the universe I track are falling within the specified guidelines.
Contact Ulli