
ETF Tracker StatSheet
You can view the latest version here.
ENDING THE WEEK ON A SOUR NOTE
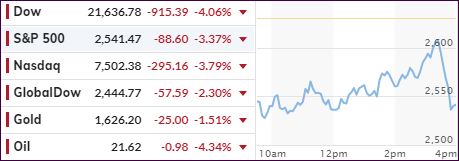
- Moving the markets
After trying to dig themselves out of an early hole, the major indexes dove into the close and just about touched the lows of the day again, caused by the Fed’s announcement that it will reduce Treasury QE from $75 billion to $60 billion per day, thereby removing the much wanted “unlimited QE” from their vocabulary.
Despite today’s set back, the S&P 500 managed a gain of some 10% for the week with some pundits claiming this rebound to be the end of the bear market.
As I posted before, markets don’t work that way, since it is a normal occurrence in bearish periods to the see reversals of a magnitude, you’ll never experience in bull markets.
What we witnessed this week, also serves as a great answer to those who question why I don’t immediately go short after a trend line break to the downside. It’s too early for that kind of action due to the ever-present volatility. The idea of nibbling at short positions comes more into play, once a slow, steady and continued downward trend has been established.
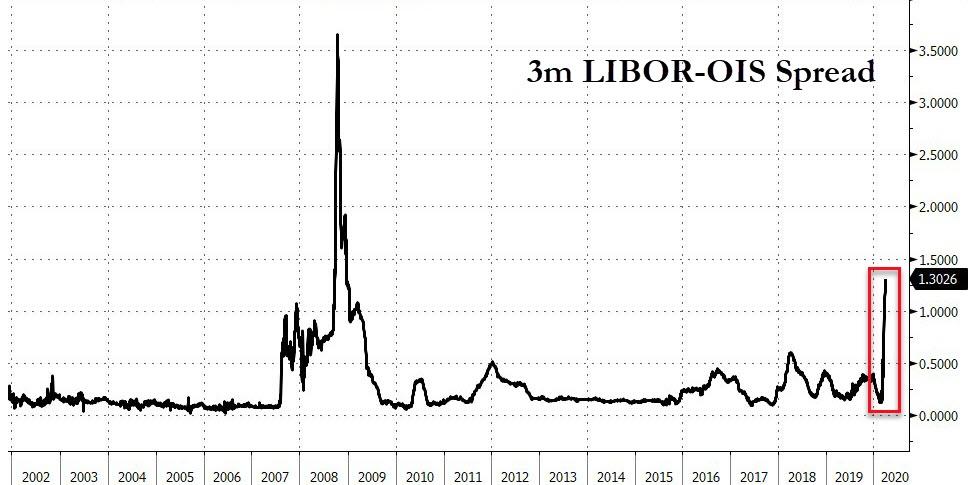
Despite Trump being scheduled to sign the government stimulus plan after the close, it was not enough of an event to keep the bullish theme alive. I expected a pullback into the weekend. After all, there could be a host of new and negative developments, not just related to the virus but also to the crisis in the LIBOR market, that nobody with a clear-thinking mind would want to be caught with long positions.
So, was this a sucker’s rally? While that is too early to tell, I must agree with JC Parets at AllStarCharts, who summed it up like this:
“I think you have to be a fool to actually think that the stock market moving an arbitrary 20% in either direction means anything to anyone anywhere in the world.”
Yes,
it will take a lot more than a 3-day 20% rebound of the temporary bottom,
after the massive fall we’ve seen, to establish a new bullish trend, like broad
participation and a host of moves of less than 1% per day.
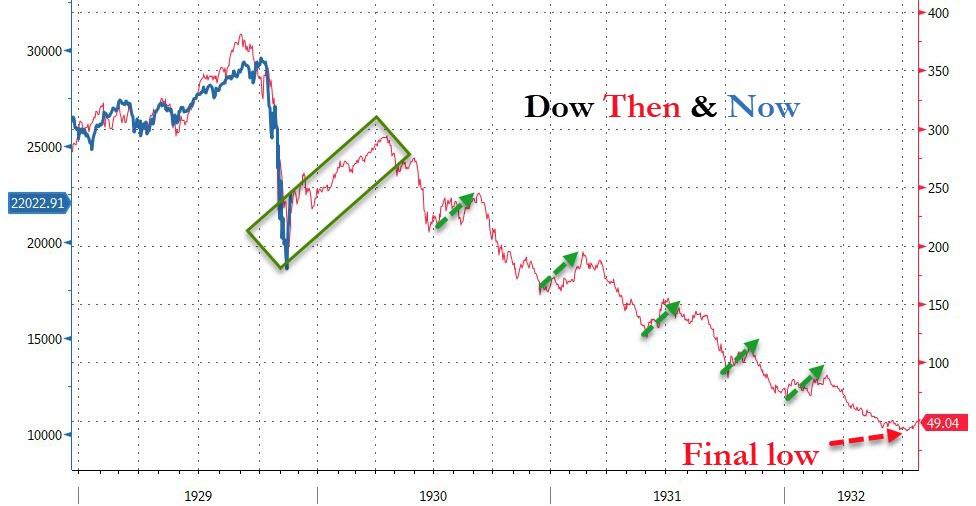
So far, the comparison to the events of 1929/30 are on target, as Bloomberg shows in this updated chart. It’s important to note that every drop was followed by a dead-cat-bounce, until the final low occurred some 2.5 years later.
I for one am curious to see if history repeats itself.
2. ETFs in the Spotlight
In case you missed the announcement and description of this section, you can again.
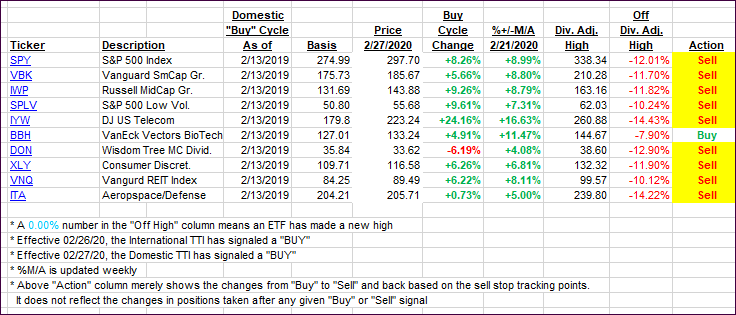
It features 10 broadly diversified and sector ETFs from my HighVolume list as posted every Saturday. Furthermore, they are screened for the lowest MaxDD% number meaning they have been showing better resistance to temporary sell offs than all others over the past year.
The below table simply demonstrates the magnitude with which some of the ETFs are fluctuating regarding their positions above or below their respective individual trend lines (%+/-M/A). A break below, represented by a negative number, shows weakness, while a break above, represented by a positive percentage, shows strength.
For hundreds of ETF choices, be sure to reference Thursday’s StatSheet.
For this past domestic “Buy” cycle, which ended on 2/27/2020, here’s how some our candidates have fared:
Click image to enlarge
Again, the %+/-M/A column above shows the position of the various ETFs in relation to their respective long-term trend lines, while the trailing sell stops are being tracked in the “Off High” column. The “Action” column will signal a “Sell” once the -8% point has been taken out in the “Off High” column. For more volatile sector ETFs, the trigger point is -10%.
3. Trend Tracking Indexes (TTIs)
Our TTIs continued to headed south again, as the major indexes dove into the close.
Domestic TTI: -22.09% below its M/A (prior close -20.91%)—Sell signal effective 02/27/2020
International TTI: -19.89% below its M/A (prior close -18.43%)—Sell signal effective 02/26/2020
Disclosure: I am obliged to inform you that I, as well as my advisory clients, own some of the ETFs listed in the above table. Furthermore, they do not represent a specific investment recommendation for you, they merely show which ETFs from the universe I track are falling within the specified guidelines.
———————————————————-
WOULD YOU LIKE TO HAVE YOUR INVESTMENTS PROFESSIONALLY MANAGED?
Do you have the time to follow our investment plans yourself? If you are a busy professional who would like to have his portfolio managed using our methodology, please contact me directly or get more details here.
———————————————————
Back issues of the ETF Tracker are available on the web.
Contact Ulli