
- Moving the markets
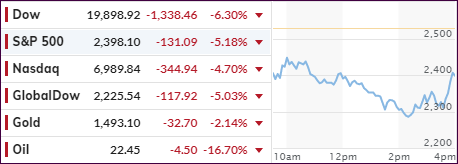
So much for yesterday’s rebound of “hope,” which got annihilated, as the major indexes took another step down. At one point, the Dow even lost its 19k level, while the S&P dropped below 2.3k, but both were pushed back up thanks to a bounce off their lows during the past 30 minutes.
Those buy-and-holders, which were hoping for the bond portion of their portfolios to bail them out, were disappointed again, as yields rose, with the 10-year being up almost 11 basis points to 1.19%, thereby exerting a double whammy loss on portfolios still exposed to this insanity.
It’s no surprise that the cause of this upheaval is the fallout from the coronavirus, as nations are shutting down, major corporations and businesses struggling and looking for bailouts, while the banking sector is about to experience some major pain, and possible failures, as above businesses may not be able to survive a sharp drop in revenue, thereby increasing the possibility of defaults. Or, better said, bank failures may be on the horizon.
Of course, the underlying problems are the same we saw in 2008, as nothing has been fixed, with ZH summing up the problem like this:
And it may come as a shock to some, but ever since the financial crisis nothing has been actually fixed, and instead the Fed stepped in at every market stress event to inject more liquidity, aiding the issuance of even more debt, and kicking the can while helping mask the symptoms of the crisis, only made the underlying financial instability even more acute.
Meanwhile, conventional wisdom that the US banking system was rendered more stable now are dead wrong, with the public and countless financial professionals fooled by the nearly two trillion in excess reserves (we all saw what happened when this number dropped to a precarious “low” of “only” $1.3 trillion in September of 2019) injected by the Fed in recent years. All this liquidity upon liquidity has only made the system that much more reliant on the Fed’s constant bailouts and liquidity injections.
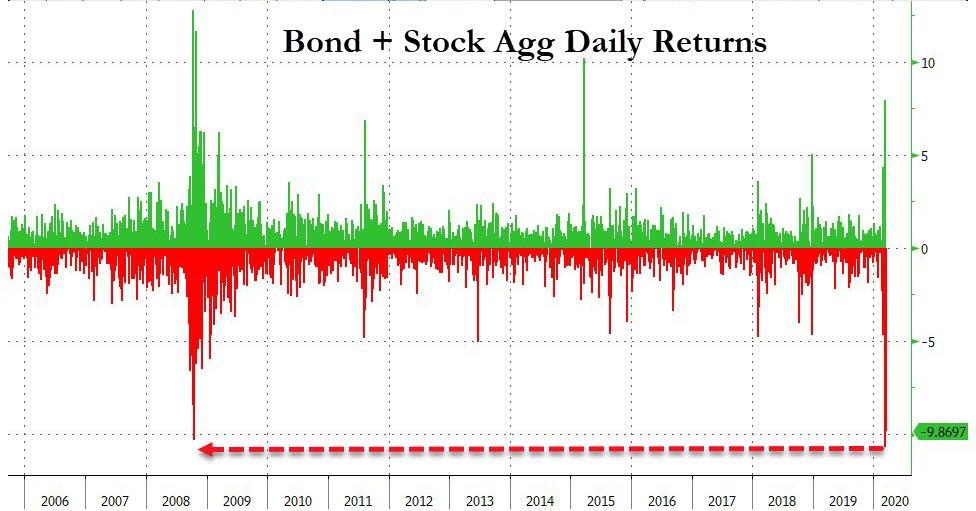
With market panic accelerating, and as I pointed out above, ZH confirmed that today was the worst day ever for a combined equity/bond portfolio, down -9.87%, as shown in Bloomberg’s chart.
The carnage may have a long way to go, so as trend trackers, we feel privileged to enjoy a front row seat on the sidelines.
2. ETFs in the Spotlight
In case you missed the announcement and description of this section, you can again.
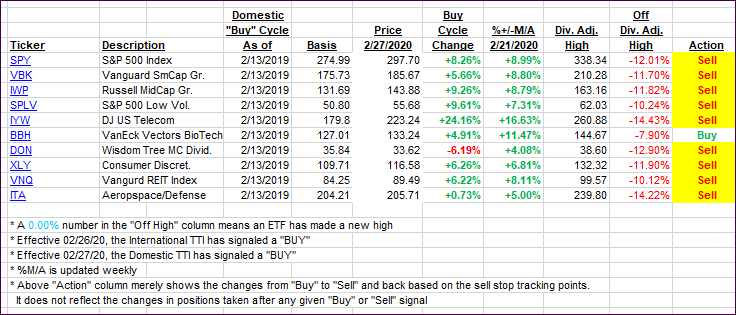
It features 10 broadly diversified and sector ETFs from my HighVolume list as posted every Saturday. Furthermore, they are screened for the lowest MaxDD% number meaning they have been showing better resistance to temporary sell offs than all others over the past year.
The below table simply demonstrates the magnitude with which some of the ETFs are fluctuating regarding their positions above or below their respective individual trend lines (%+/-M/A). A break below, represented by a negative number, shows weakness, while a break above, represented by a positive percentage, shows strength.
For hundreds of ETF choices, be sure to reference Thursday’s StatSheet.
For this past domestic “Buy” cycle, which ended on 2/27/2020, here’s how some our candidates have fared:
Click image to enlarge
Again, the %+/-M/A column above shows the position of the various ETFs in relation to their respective long-term trend lines, while the trailing sell stops are being tracked in the “Off High” column. The “Action” column will signal a “Sell” once the -8% point has been taken out in the “Off High” column. For more volatile sector ETFs, the trigger point is -10%.
3. Trend Tracking Indexes (TTIs)
Our TTIs headed south, as the bear exacted another pound of flesh from the buy-and-hold crowd.
Here’s how we closed 03/18/2020:
Domestic TTI: -28.18% below its M/A (prior close -23.18%)—Sell signal effective 02/27/2020
International TTI: -27.95% below its M/A (prior close -24.04%)—Sell signal effective 02/26/2020
Disclosure: I am obliged to inform you that I, as well as my advisory clients, own some of the ETFs listed in the above table. Furthermore, they do not represent a specific investment recommendation for you, they merely show which ETFs from the universe I track are falling within the specified guidelines.
Contact Ulli