
- Moving the markets
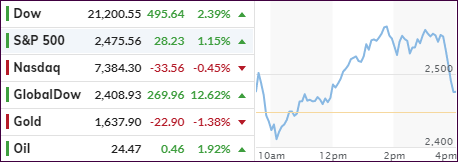
Another strong rally lost half of its early gains late in the session, as the upbeat mood waned with some chart watchers confirming what I said yesterday, namely that big rebounds are not necessarily a sign that a bottom has been formed.
More importantly, the indexes plunged into the close based on news that a potential snag in the $2 trillion stimulus package may delay its adoption and implementation, something that did not go over well on Wall Street, as urgency to battle the corona virus economic fallout effects have taken front and center.
Bernie Sanders turned out to be the culprit spoiling the party by threatening to hold up the rescue package “until stronger conditions are the imposed on the $500 billion corporate welfare fund.” Who knows how long that battle will go on?
As a result, it’s a tug-of-war between the hopefully positive effects of the stimulus plan, once passed, and the negative impact from the corona virus. I am sure that the stimulus plan will give an assist, but I doubt that the package is even close to being enough to reverse the damage done, so I expect more proposals over the next month or so.
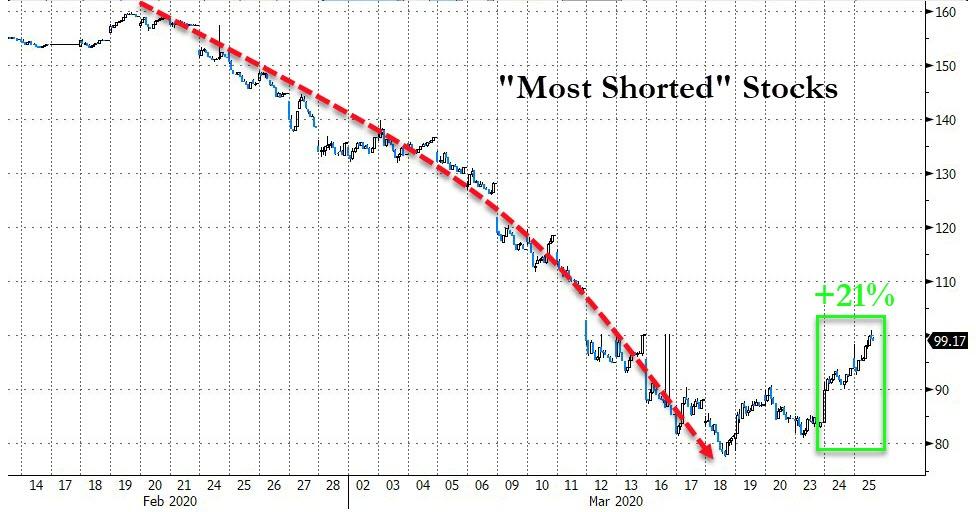
Again, as ZH reported, the giant short squeeze continued pushing the most shorted stocks up by an amazing +21% in two days, which Bloomberg demonstrated in this chart.
Overnight, we saw extreme shifts again:
Dow futures show the insane scale of today’s moves best – a 1000 point surge into yesterday’s close, a failed 1000 point surge overnight (on the “deal”), another failed 1000 point surge into and through the cash open, and then a 1500 points surge that almost held into the close…
With all that uncertainty causing markets to behave in the most unpredictable manor I have ever seen, the safest place to watch this debacle unfold is from the sidelines.
2. ETFs in the Spotlight
In case you missed the announcement and description of this section, you can again.
It features 10 broadly diversified and sector ETFs from my HighVolume list as posted every Saturday. Furthermore, they are screened for the lowest MaxDD% number meaning they have been showing better resistance to temporary sell offs than all others over the past year.
The below table simply demonstrates the magnitude with which some of the ETFs are fluctuating regarding their positions above or below their respective individual trend lines (%+/-M/A). A break below, represented by a negative number, shows weakness, while a break above, represented by a positive percentage, shows strength.
For hundreds of ETF choices, be sure to reference Thursday’s StatSheet.
For this past domestic “Buy” cycle, which ended on 2/27/2020, here’s how some our candidates have fared:
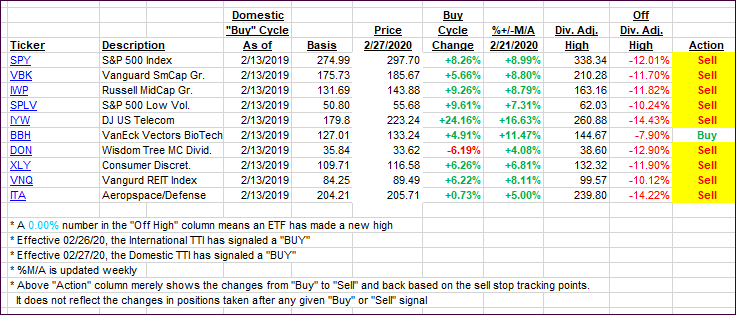
Click image to enlarge
Again, the %+/-M/A column above shows the position of the various ETFs in relation to their respective long-term trend lines, while the trailing sell stops are being tracked in the “Off High” column. The “Action” column will signal a “Sell” once the -8% point has been taken out in the “Off High” column. For more volatile sector ETFs, the trigger point is -10%.
3. Trend Tracking Indexes (TTIs)
Our TTIs headed improves slightly with the markets attempting to build on yesterday’s rebound.
Here’s how we closed 03/25/2020:
Domestic TTI: -25.21% below its M/A (prior close -27.04%)—Sell signal effective 02/27/2020
International TTI: -21.45% below its M/A (prior close -24.11%)—Sell signal effective 02/26/2020
Disclosure: I am obliged to inform you that I, as well as my advisory clients, own some of the ETFs listed in the above table. Furthermore, they do not represent a specific investment recommendation for you, they merely show which ETFs from the universe I track are falling within the specified guidelines.
Contact Ulli