
- Moving the markets
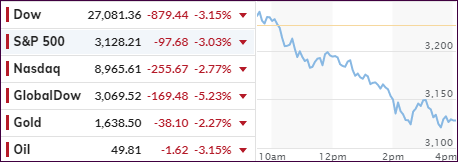
For those hoping for a turnaround Tuesday, it did not happen, as virus headwinds continued to spread around the world. An early rebound proved to be meaningless with the downward trend remaining intact.
Internationally, it was worse than domestically, with our International TTI diving below its long-term trend line by a margin large enough to generate a “Sell” signal for that arena. Please see section 3 for details.
Market sentiment was mixed, as dip buyers try to step in to prop up the indexes, but volume was not heavy enough to accomplish anything other than a temporary halt in the downward swing.
After Monday’s drubbing, traders expected a bounce back, or at least a pause in downward momentum, but the tumble continued unabated. Of course, investor complacency, caused by the Fed’s support policy of the markets, has many in shock, as realization set in that markets can go down, and that corrections of 5-10% are a perfectly normal occurrence.
Not helping the mood were some economic news showing that the Fed Business Survey crashed in February with new orders collapsing, while Subprime Credit Card Delinquencies spiked to record highs and surpassed the financial-crisis peak.
The S&P 500 price of 3,200 was considered by some analysts a crucial support level and, once broken, could lead to higher volatility and more downside risk, in the -10% area. Well, the level did not put up any fight, and the index sliced right through it closing the session at 3,130.
As a result, our Domestic TTI, the main directional indicator, headed south as well and has now reached a point that is within striking distance of a “Sell” signal. As you can see in section 3 below, we are currently only 0.35% away from this event becoming reality.
If it does, and the trendline is clearly pierced to the downside, we will move out of the markets and to the safety of the sidelines, as the odds of this turning into a full-blown bear market will have increased.
Fed vice-chair Clarida did not help matters by saying:
US economy and monetary policy are in a good place, noting that it is still too soon to speculate on whether the coronavirus will lead to a material change in US economic outlook.
Despite a temporary pause in the drop, while Clarida was talking, downward momentum picked up again, as it became clear that there were no solutions or promises forthcoming. Interestingly, the chart I posted last week, proved to be an accurate prognosticator, as the S&P 500 finally caught down to global liquidity.
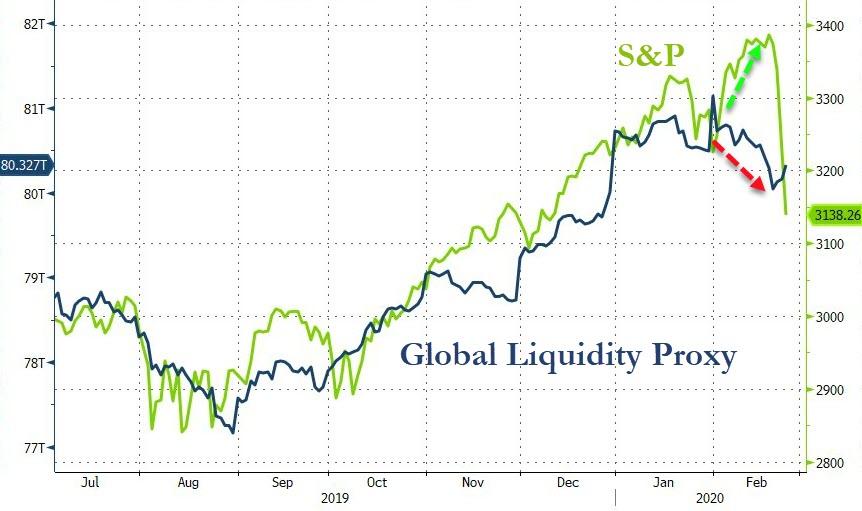
In my advisor practice, we will start liquidating some of those positions, whose trailing sell stops were triggered, and will prepare for an all-out domestic “Sell” signal.
2. ETFs in the Spotlight
In case you missed the announcement and description of this section, you can again.
It features 10 broadly diversified and sector ETFs from my HighVolume list as posted every Saturday. Furthermore, they are screened for the lowest MaxDD% number meaning they
have been showing better resistance to temporary sell offs than all others over the past year.
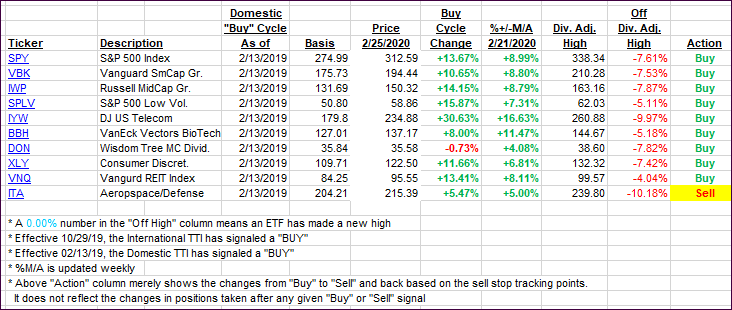
The below table simply demonstrates the magnitude with which some of the ETFs are fluctuating regarding their positions above or below their respective individual trend lines (%+/-M/A). A break below, represented by a negative number, shows weakness, while a break above, represented by a positive percentage, shows strength.
For hundreds of ETF choices, be sure to reference Thursday’s StatSheet.
For this current domestic “Buy” cycle, here’s how some our candidates have fared:
Click image to enlarge
Again, the %+/-M/A column above shows the position of the various ETFs in relation to their respective long-term trend lines, while the trailing sell stops are being tracked in the “Off High” column. The “Action” column will signal a “Sell” once the -8% point has been taken out in the “Off High” column. For more volatile sector ETFs, the trigger point is -10%.
3. Trend Tracking Indexes (TTIs)
Our Trend Tracking Indexes (TTIs) took another dive as relentless selling continued for the second day.
Here’s how we closed 02/25/2020:
Domestic TTI: +0.35% above its M/A (prior close +3.83%)—Buy signal effective 02/13/2019
International TTI: -1.13% below its M/A (prior close +1.17%)—Buy signal effective 10/29/2019
We will liquidate those positions, which have triggered their trailing sell stops, unless there is a rebound in the making, in which case I will hold off for another day.
Our International TTI signaled a “Sell” effective tomorrow, but since we did not have any international holdings, we are not affected by it.
Disclosure: I am obliged to inform you that I, as well as my advisory clients, own some of the ETFs listed in the above table. Furthermore, they do not represent a specific investment recommendation for you, they merely show which ETFs from the universe I track are falling within the specified guidelines.
Contact Ulli