- Moving the markets
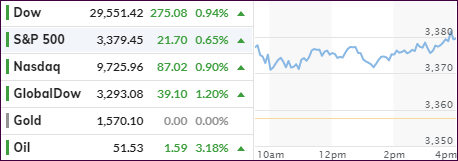
The major indexes gapped higher at the opening and raced into record territory supported by news that the number of new coronaviruses has slowed down. We all know that the accuracy of those numbers coming out of China remains questionable at best, market reaction, while positive, can also be premature.
While the last few weeks have been devastating, as the number of new cases and the death tolls have accelerated, you would not know it by looking at recent market performance, where it seems that FOMO (Fear Of Missing Out) remains one of the drivers that keeps pushing prices higher.
This continued levitation has occurred despite a slowdown in global liquidity, as this chart demonstrates. It also shows that, if history any guide and liquidity does not pick up, a correction may be in the cards. In the end, however, the unshakable belief that the central banks will come to the rescue with their liquidity spigot wide open, may keep any pullback modest in nature.
Comparisons to the past may have no bearing on the future, but at least it’s interesting to observe if history, as shown in this chart by Bloomberg, will repeat itself.
2. ETFs in the Spotlight
In case you missed the announcement and description of this section, you can again.
It features 10 broadly diversified and sector ETFs from my HighVolume list as posted every Saturday. Furthermore, they are screened for the lowest MaxDD% number meaning they
have been showing better resistance to temporary sell offs than all others over the past year.
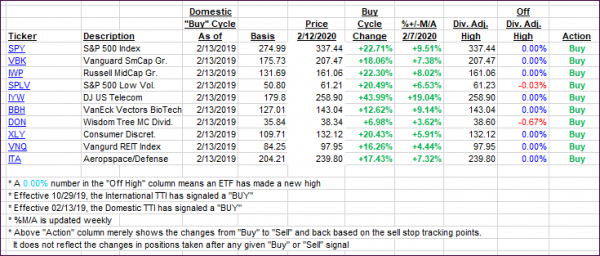
The below table simply demonstrates the magnitude with which some of the ETFs are fluctuating regarding their positions above or below their respective individual trend lines (%+/-M/A). A break below, represented by a negative number, shows weakness, while a break above, represented by a positive percentage, shows strength.
For hundreds of ETF choices, be sure to reference Thursday’s StatSheet.
For this current domestic “Buy” cycle, here’s how some our candidates have fared:

Click image to enlarge
Again, the %+/-M/A column above shows the position of the various ETFs in relation to their respective long-term trend lines, while the trailing sell stops are being tracked in the “Off High” column. The “Action” column will signal a “Sell” once the -8% point has been taken out in the “Off High” column. For more volatile sector ETFs, the trigger point is -10%.
3. Trend Tracking Indexes (TTIs)
Our Trend Tracking Indexes (TTIs) jumped as the bulls showed no signs of letting up.
Here’s how we closed 02/12/2020:
Domestic TTI: +8.90% above its M/A (prior close +8.16%)—Buy signal effective 02/13/2019
International TTI: +6.59% above its M/A (prior close +5.91%)—Buy signal effective 10/29/2019
Disclosure: I am obliged to inform you that I, as well as my advisory clients, own some of the ETFs listed in the above table. Furthermore, they do not represent a specific investment recommendation for you, they merely show which ETFs from the universe I track are falling within the specified guidelines.
Contact Ulli