
ETF Tracker StatSheet
You can view the latest version here.
A BLOODBATH WEEK
- Moving the markets
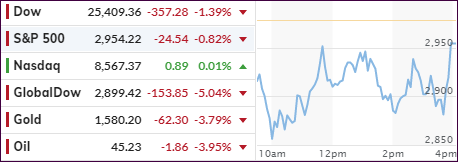
I thought that after the drubbing of the past few days, with us getting out of the market altogether, that a rebound might finally be in order. But no such luck, as the Dow continued swan diving by being down another 1,000 points shortly after the opening, but it recovered at the end of the session. Losses were heavy for the week with the S&P 500 plunging some -11.5%.
Again, the fact the world may be facing a combination of supply and demand shock seems to be slowly sinking in and is clearly reflected in this week’s sell-off, as markets are anticipatory in nature—and in this case are anticipating the worst.
One analyst explains it in a simplified way:
China has closed a reported 70,000 movie theatres because of the virus. That’s a supply shock, and no amount of income (demand) stimulus will boost ticket sales. Of course, people may increase the number of downloads of films and games to play at home, as we have seen, but this is nothing more than drops in the ocean in terms of the overall economy.
Despite calls for the Fed to cut rates as an emergency measure, officials so far have pushed back and have remained non-committal. I believe that by next week, we might see a change of heart with Central Bankers creating coordinated efforts to cut rates and increase liquidity, all in the hope of putting a floor under this market.
While this may boost equities on a short-term basis, the Fed can’t print a vaccine to solve the coronavirus issue, so we’ll be back shortly having to face and deal with the fallout effects.
To put this week’s bloodbath into perspective, ZH posted that the Dow saw its fastest collapse from an all-time peak since 1928, while the S&P 500 suffered its fastest peak-to-correction plunge ever.
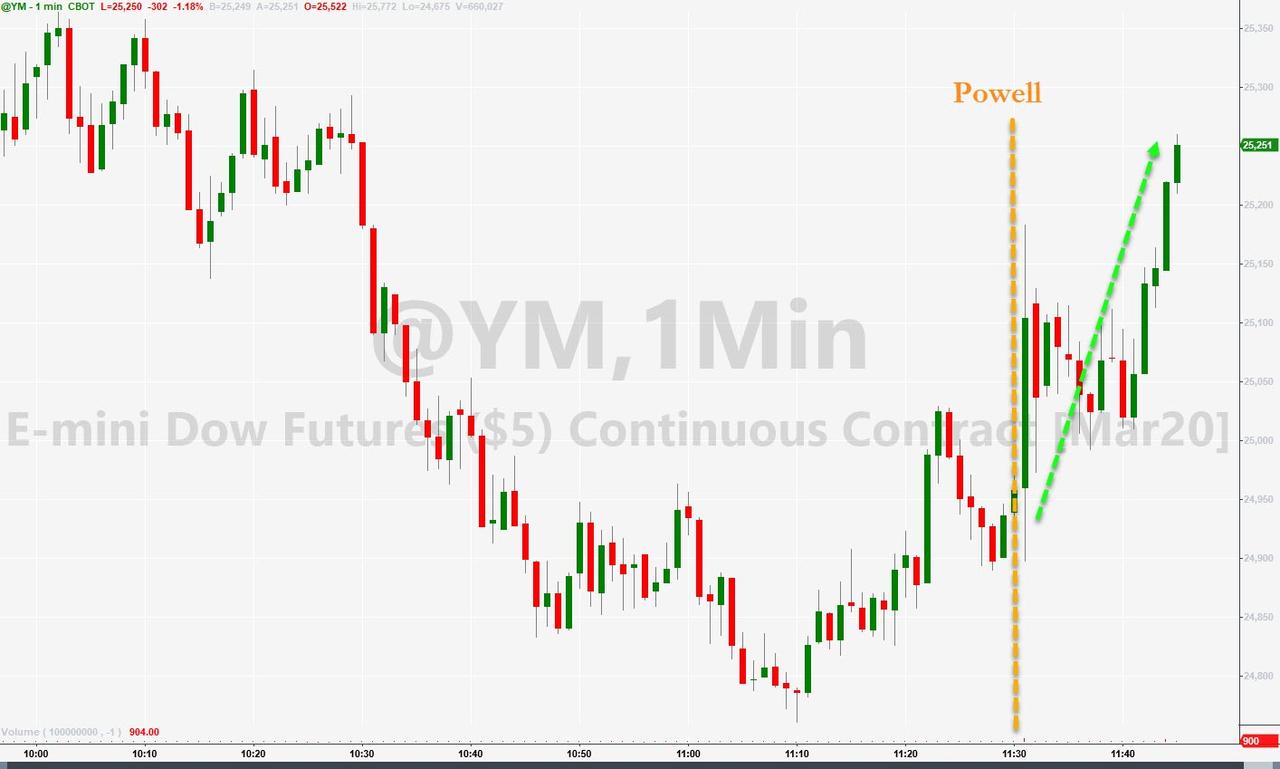
Fed head Powell made an appearance and spoke in general terms to calm the markets, which finally created a small rebound effect. Even if the now anticipated rate cut materializes, the outcome is far from being certain. ZH summed it up best:
In other words, if or rather when the corona pandemic gets even worse after central banks have fired their collective bazooka, the market’s response will be far more adverse as central banks will have staked their credibility on being able to offset the economic consequences of the pandemic (they can’t, unless they can print viral antibodies), while investors will now be looking into the abyss…
Nobody knows how this will play, but I am glad we’re watching this movie from the sidelines.
2. ETFs in the Spotlight
In case you missed the announcement and description of this section, you can again.
It features 10 broadly diversified and sector ETFs from my HighVolume list as posted every Saturday. Furthermore, they are screened for the lowest MaxDD% number meaning they
have been showing better resistance to temporary sell offs than all others over the past year.
The below table simply demonstrates the magnitude with which some of the ETFs are fluctuating regarding their positions above or below their respective individual trend lines (%+/-M/A). A break below, represented by a negative number, shows weakness, while a break above, represented by a positive percentage, shows strength.
For hundreds of ETF choices, be sure to reference Thursday’s StatSheet.
For this current domestic “Buy” cycle, here’s how some our candidates have fared:
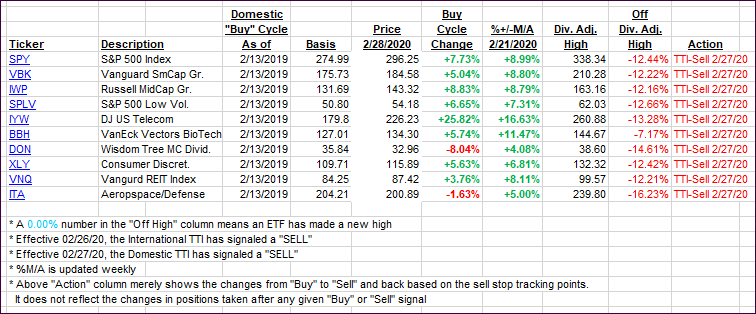
Click image to enlarge
Again, the %+/-M/A column above shows the position of the various ETFs in relation to their respective long-term trend lines, while the trailing sell stops are being tracked in the “Off High” column. The “Action” column will signal a “Sell” once the -8% point has been taken out in the “Off High” column. For more volatile sector ETFs, the trigger point is -10%.
3. Trend Tracking Indexes (TTIs)
Our TTIs dropped further and are now deeply anchored on the bearish side of their respective trend lines. A bullish view would come into play, once these indicators move back above their lines accompanied by some staying power.
Here’s how we closed 02/28/2020:
Domestic TTI: -5.82% below its M/A (prior close -4.75%)—Sell signal effective 02/27/2020
International TTI: -6.61% below its M/A (prior close -4.58%)—Sell signal effective 02/26/2020
Disclosure: I am obliged to inform you that I, as well as my advisory clients, own some of the ETFs listed in the above table. Furthermore, they do not represent a specific investment recommendation for you, they merely show which ETFs from the universe I track are falling within the specified guidelines.
———————————————————-
WOULD YOU LIKE TO HAVE YOUR INVESTMENTS PROFESSIONALLY MANAGED?
Do you have the time to follow our investment plans yourself? If you are a busy professional who would like to have his portfolio managed using our methodology, please contact me directly or get more details here.
———————————————————
Back issues of the ETF Tracker are available on the web.
Contact Ulli