
- Moving the markets
The adage that “sometimes nothing happens in a decade and sometimes a decade happens in a week” sure rang true, as the coronavirus induced sell fest continued with utter abandon with downward momentum accelerating.
As I posted yesterday, my planned limited liquidation of broadly diversified domestic ETFs turned into a “Sell All” early in the session, as the major indexes continued with their best imitation of a swan dive. Besides some hedged holdings and gold, we are now in cash watching this debacle unfold from the sidelines.
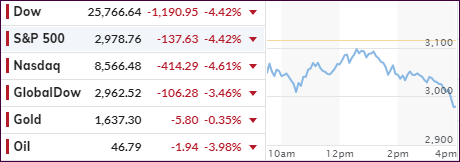
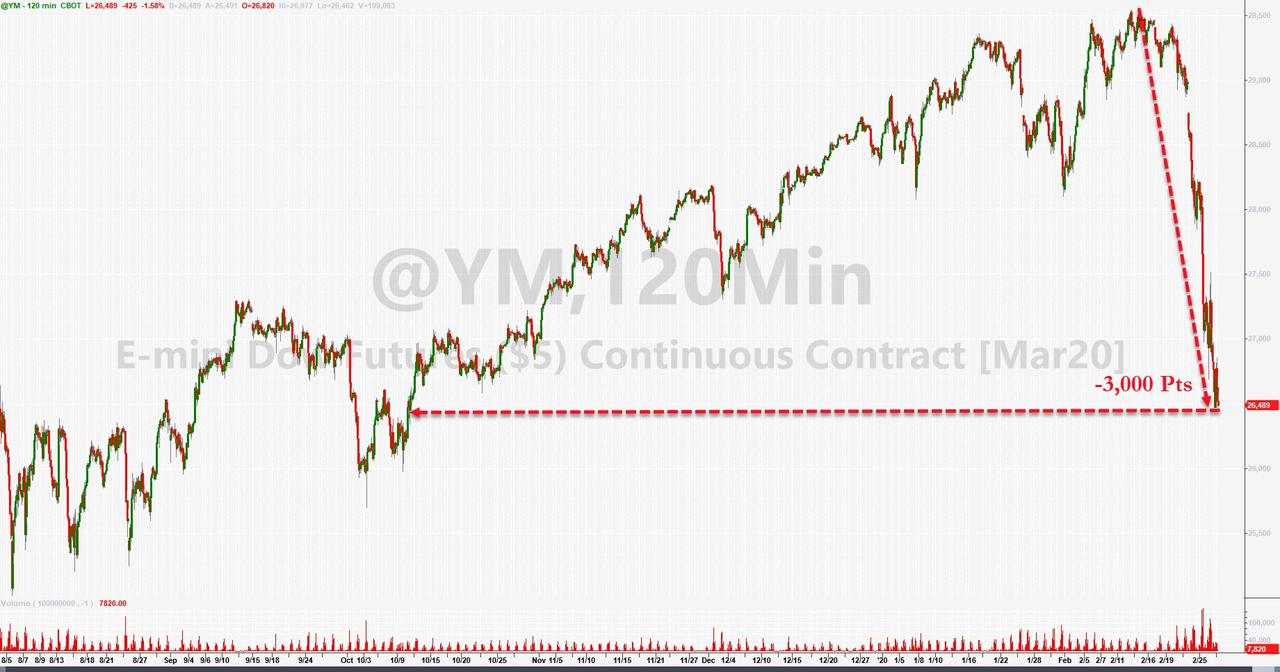
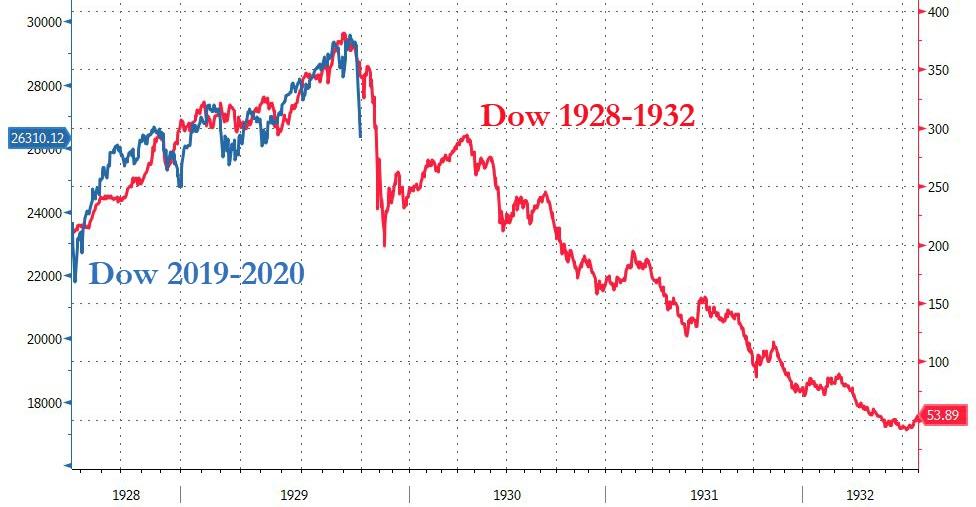
As ZH elaborated, in the space of just six days, we went from a record high to a correction with the Dow down over 3,000 points or -10.5%). At the same, the eerily familiar comparisons to the events of 1928-1932 are making the rounds, with this chart providing the comparison to current market activity.
Then this:
The market is already pricing in at least 3 rate-cuts in 2020 and the odds of March cut are soaring, despite the obvious fact that The Fed can’t print vaccines to ‘salve’ the supply-chain block and if lower rates are supposed to spark more consumption, where are you going to consume? Not at crowded public places like theaters, restaurants, and sports stadiums?
It’s seems to become more well known that global economies are facing an unexpected and unprecedented supply chain shock that can’t be fixed quickly and will leave the Central Banks somewhat powerless, although I expect the liquidity spigots to be wide open soon.
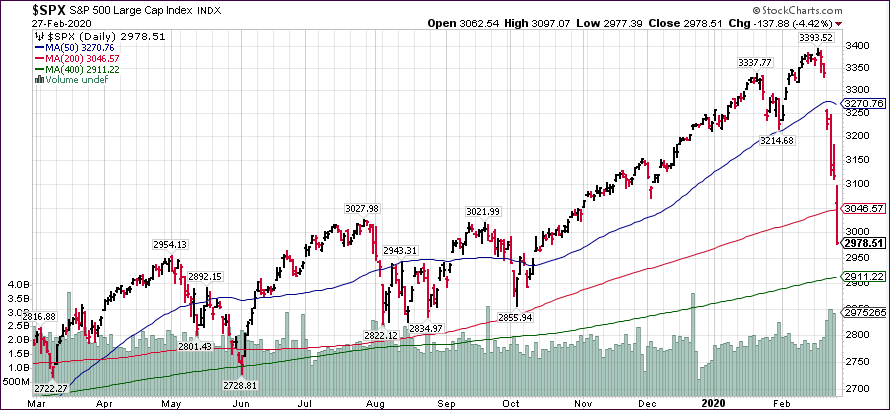
To add insult to injury was the fact that the widely followed S&P 500 “lost” it’s 200-day moving average, as this chart shows. This means that downward momentum could worsen and deepen this newly formed bear market.
It’s good to be on the sidelines for the time being.
2. ETFs in the Spotlight
In case you missed the announcement and description of this section, you can again.
It features 10 broadly diversified and sector ETFs from my HighVolume list as posted every Saturday. Furthermore, they are screened for the lowest MaxDD% number meaning they
have been showing better resistance to temporary sell offs than all others over the past year.
The below table simply demonstrates the magnitude with which some of the ETFs are fluctuating regarding their positions above or below their respective individual trend lines (%+/-M/A). A break below, represented by a negative number, shows weakness, while a break above, represented by a positive percentage, shows strength.
For hundreds of ETF choices, be sure to reference Thursday’s StatSheet.
For this current domestic “Buy” cycle, here’s how some our candidates have fared:
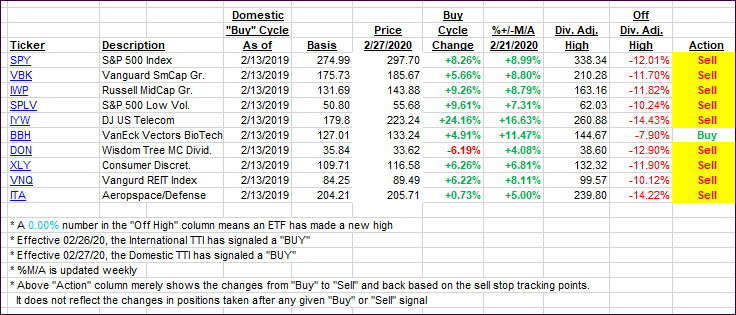
Click image to enlarge
Again, the %+/-M/A column above shows the position of the various ETFs in relation to their respective long-term trend lines, while the trailing sell stops are being tracked in the “Off High” column. The “Action” column will signal a “Sell” once the -8% point has been taken out in the “Off High” column. For more volatile sector ETFs, the trigger point is -10%.
3. Trend Tracking Indexes (TTIs)
As mentioned above, the downward acceleration continued unabated and both of our TTIs plunged into bear market territory. As a result of this mornings action, I liquidated “all,” and we are now on the sidelines.
Here’s how we closed 02/27/2020:
Domestic TTI: -4.75% below its M/A (prior close -0.62%)—Sell signal effective 02/27/2020
International TTI: -4.58% below its M/A (prior close -1.63%)—Sell signal effective 02/26/2020
Disclosure: I am obliged to inform you that I, as well as my advisory clients, own some of the ETFs listed in the above table. Furthermore, they do not represent a specific investment recommendation for you, they merely show which ETFs from the universe I track are falling within the specified guidelines.
Contact Ulli