
- Moving the markets
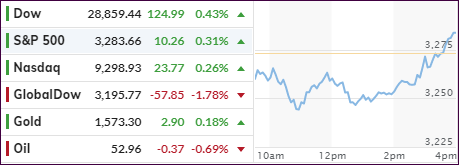
Right after the opening bell, the markets headed south following the global negative sentiment caused by a sell-off in Asia, as coronavirus issues again fanned fears of slowing economic growth worldwide.
Concerns about the epidemic’s impact first overpowered upbeat earnings news from Microsoft and Tesla, with airline stocks falling due to the travel disruptions, as the virus spread. Chinese news outlets reported of 7,700 infections with at least 170 deaths.
China’s stock markets will remain closed till next Monday, but concerns are increasing that those markets will head south as investors there will have to catch up with the reality of the virus and its impact.
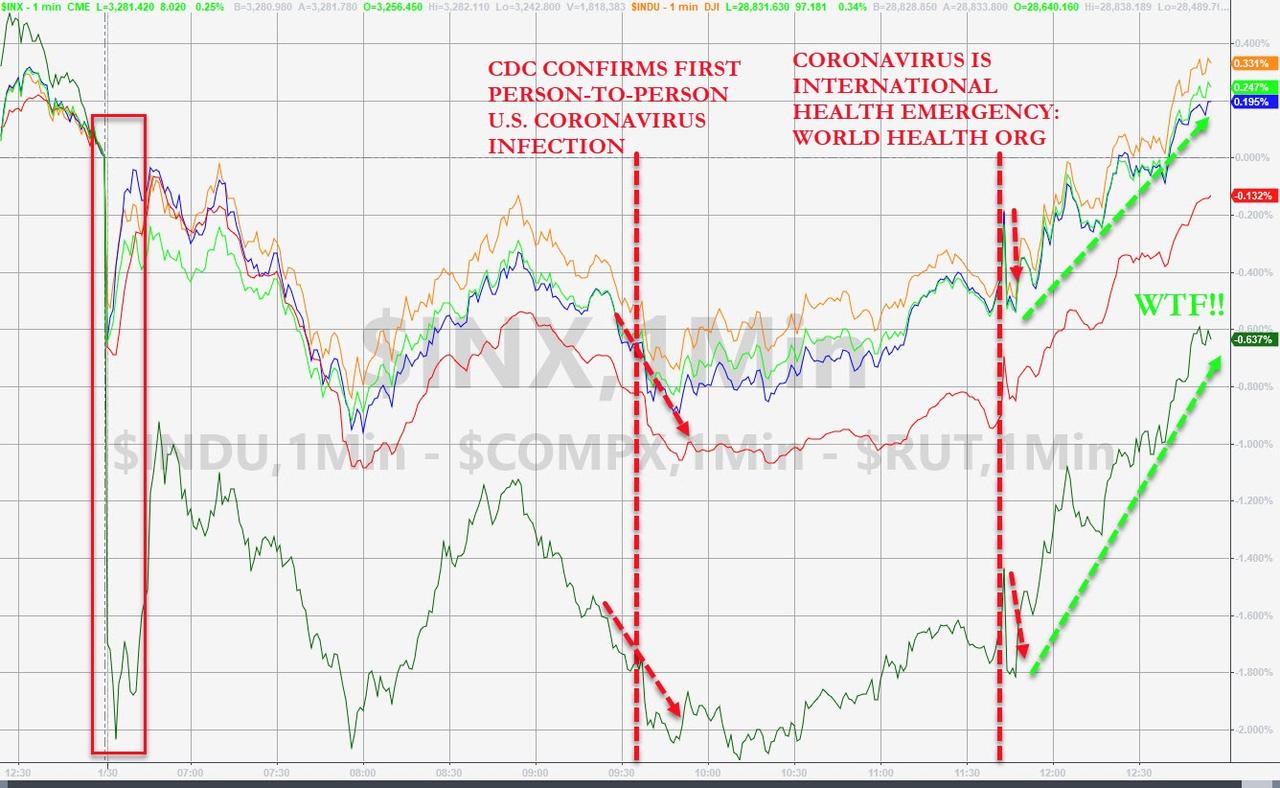
The WHO (World Health Organization) finally named the virus outbreak, which originated in China, a “public health emergency of international concern.” That kept downward pressure on stocks, although they managed to come off their lows of the session, rebounded in the last hour and squeezed out an unexpected green close.
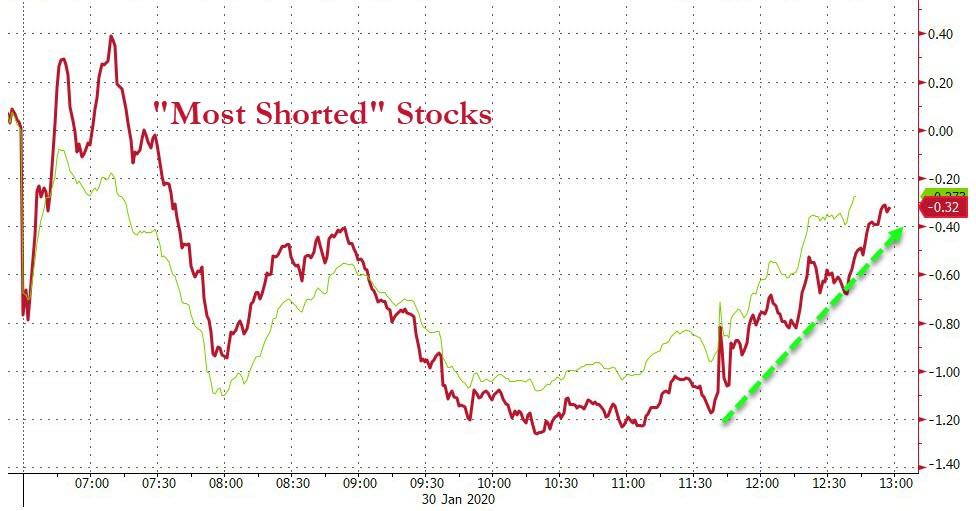
As we’ve seen many times in the past, a short-squeeze provided the ammo for the last hour ramp, which made sure that, with one trading day to go, the Dow is back in the green for the year. We’ll find out tomorrow, if it closes the month on a positive note.
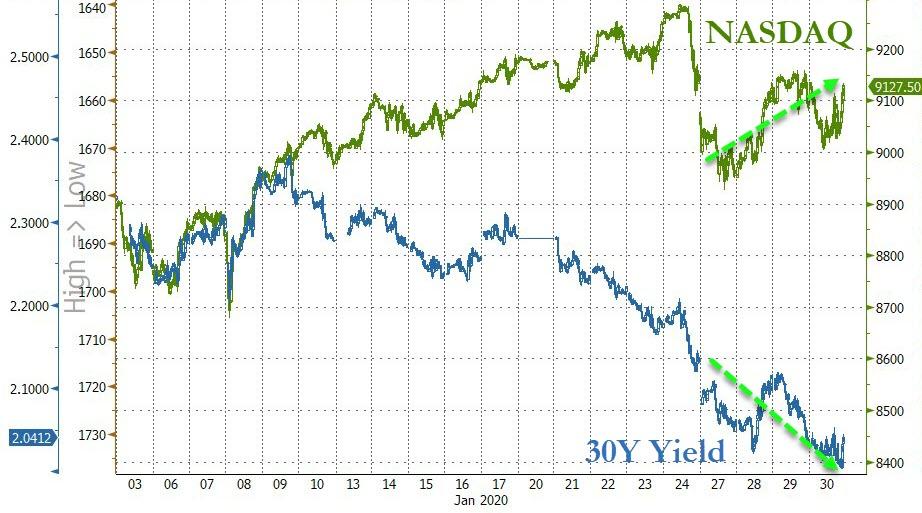
In the meantime, the decoupling between stocks and bond yields continued unabated.
2. ETFs in the Spotlight
In case you missed the announcement and description of this section, you can again.
It features 10 broadly diversified and sector ETFs from my HighVolume list as posted every Saturday. Furthermore, they are screened for the lowest MaxDD% number meaning they have been showing better resistance to temporary sell offs than all others over the past year.
The below table simply demonstrates the magnitude with which some of the ETFs are fluctuating regarding their positions above or below their respective individual trend lines (%+/-M/A). A break below, represented by a negative number, shows weakness, while a break above, represented by a positive percentage, shows strength.
For hundreds of ETF choices, be sure to reference Thursday’s StatSheet.
For this current domestic “Buy” cycle, here’s how some our candidates have fared:
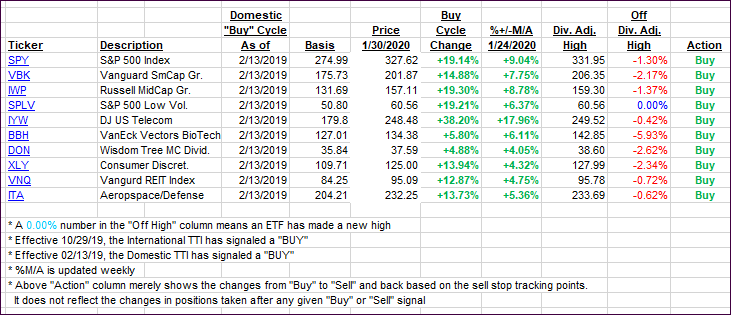
Click image to enlarge
Again, the %+/-M/A column above shows the position of the various ETFs in relation to their respective long-term trend lines, while the trailing sell stops are being tracked in the “Off High” column. The “Action” column will signal a “Sell” once the -8% point has been taken out in the “Off High” column. For more volatile sector ETFs, the trigger point is -10%.
3. Trend Tracking Indexes (TTIs)
Our Trend Tracking Indexes (TTIs) were mixed with the International one displaying a lot more weakness.
Here’s how we closed 01/30/2020:
Domestic TTI: +6.74% above its M/A (prior close +6.51%)—Buy signal effective 02/13/2019
International TTI: +3.71% above its M/A (prior close +4.37%)—Buy signal effective 10/29/2019
Disclosure: I am obliged to inform you that I, as well as my advisory clients, own some of the ETFs listed in the above table. Furthermore, they do not represent a specific investment recommendation for you, they merely show which ETFs from the universe I track are falling within the specified guidelines.
Contact Ulli