
- Moving the markets
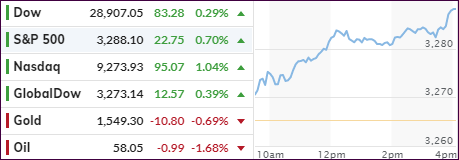
The bullish mood continued with the S&P and Nasdaq setting new records, while the Dow briefly crossed its 29k marker but backed off later in the session.
Supporting the ramp higher was news that the U.S. no longer plans on designating China a currency manipulator, which is mainly a symbolic designation but was also seen as a good will gesture.
That further seems to soothe the always raw nerves in the US-China trade battle, which are scheduled to be signed this Wednesday, although it will only be a Phase-1 settlement with other negotiations to follow with the goal to eventually achieve a full resolution.
With the earnings season on deck, rumors circulated that, once world’s largest investment banks show their report cards, some of the details (fixed income) may not be as bad as feared, which lent support to today’s advance.
Taking top billing today was the Nasdaq with a +1.04% gain, while the S&P settled for 2nd place with a nice showing of +0.7%, a good chunk of which came during the last hour push, as we have witnessed many times in the past.
All eyes are now on tomorrow’s start of the financial earnings reporting cycle, which may very well give a hint as to what else is to come.
2. ETFs in the Spotlight
In case you missed the announcement and description of this section, you can again.
It features 10 broadly diversified and sector ETFs from my HighVolume list as posted every Saturday. Furthermore, they are screened for the lowest MaxDD% number meaning they have been showing better resistance to temporary sell offs than all others over the past year.
The below table simply demonstrates the magnitude with which some of the ETFs are fluctuating regarding their positions above or below their respective individual trend lines (%+/-M/A). A break below, represented by a negative number, shows weakness, while a break above, represented by a positive percentage, shows strength.
For hundreds of ETF choices, be sure to reference Thursday’s StatSheet.
For this current domestic “Buy” cycle, here’s how some our candidates have fared:

Click image to enlarge
Again, the %+/-M/A column above shows the position of the various ETFs in relation to their respective long-term trend lines, while the trailing sell stops are being tracked in the “Off High” column. The “Action” column will signal a “Sell” once the -8% point has been taken out in the “Off High” column. For more volatile sector ETFs, the trigger point is -10%.
3. Trend Tracking Indexes (TTIs)
Our Trend Tracking Indexes (TTIs) jumped to reach new all-time highs.
Here’s how we closed 01/13/2020:
Domestic TTI: +8.10% above its M/A (prior close +7.43%)—Buy signal effective 02/13/2019
International TTI: +6.56% above its M/A (prior close +6.15%)—Buy signal effective 10/29/2019
Disclosure: I am obliged to inform you that I, as well as my advisory clients, own some of the ETFs listed in the above table. Furthermore, they do not represent a specific investment recommendation for you, they merely show which ETFs from the universe I track are falling within the specified guidelines.
Contact Ulli