
- Moving the markets
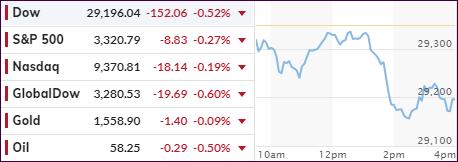
Sometimes, any reason will do for the markets to pull back, especially after they’ve been on a relentless tear. Today, news of the first case of the coronavirus in the U.S. seemed to dampen spirits, and risk assets were sold.
No surprise there, because after the record setting run of the major indexes, a pull back was way overdue, after the S&P had risen for two consecutive weeks, while the Nasdaq had been on fire sporting gains for six straight weeks.
So, today’s less than -0.5% retreat is not even newsworthy. Not helping the Dow was Boeing, whose troubles with their 737 Max airplanes don’t seem to go away and news, that the company is in talks “to secure a loan of $10 billion or more,” certainly did not create any warm and fuzzy feelings for investors.
You could consider today’s market activity simply being a case of investor fatigue, as in addition to the above, sluggish economic growth outside the U.S., and the start of the impeachment trial, all combined to let the bears finally have their moment in the sun.
2. ETFs in the Spotlight
In case you missed the announcement and description of this section, you can again.
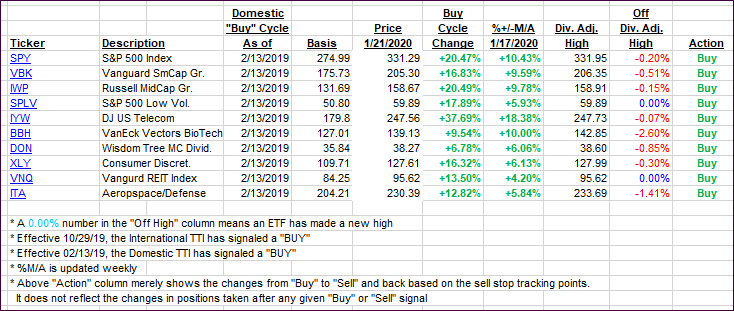
It features 10 broadly diversified and sector ETFs from my HighVolume list as posted every Saturday. Furthermore, they are screened for the lowest MaxDD% number meaning they have been showing better resistance to temporary sell offs than all others over the past year.
The below table simply demonstrates the magnitude with which some of the ETFs are fluctuating regarding their positions above or below their respective individual trend lines (%+/-M/A). A break below, represented by a negative number, shows weakness, while a break above, represented by a positive percentage, shows strength.
For hundreds of ETF choices, be sure to reference Thursday’s StatSheet.
For this current domestic “Buy” cycle, here’s how some our candidates have fared:
Click image to enlarge
Again, the %+/-M/A column above shows the position of the various ETFs in relation to their respective long-term trend lines, while the trailing sell stops are being tracked in the “Off High” column. The “Action” column will signal a “Sell” once the -8% point has been taken out in the “Off High” column. For more volatile sector ETFs, the trigger point is -10%.
3. Trend Tracking Indexes (TTIs)
Our Trend Tracking Indexes (TTIs) pulled back as buying interest was absent after this 3-day holiday.
Here’s how we closed 01/21/2020:
Domestic TTI: +8.91% above its M/A (prior close +9.37%)—Buy signal effective 02/13/2019
International TTI: +6.61% above its M/A (prior close +7.24%)—Buy signal effective 10/29/2019
Disclosure: I am obliged to inform you that I, as well as my advisory clients, own some of the ETFs listed in the above table. Furthermore, they do not represent a specific investment recommendation for you, they merely show which ETFs from the universe I track are falling within the specified guidelines.
Contact Ulli