
- Moving the markets
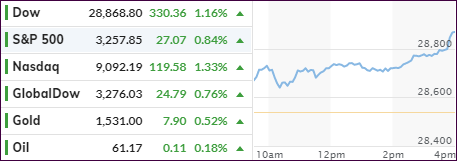
The major indexes continued where they left off on the last day of 2019 and roared into 2020 with utter abundance, with all three of them gaining solidly. The entire session was supported by the bullish theme of last year, and we ended up accelerating into the close, although SmallCaps underperformed.
A big assist came from the Chinese Central Bank when it announced that it would reduce reserve requirement for commercial banks, thereby creating a stimulus effect for the country’s economy. That seemed to confirm the general view of all Central Banks, who for now appear to be in sync with their loose monetary policies.
The goodwill mood created by the Phase-1 trade agreement, which is scheduled to be signed on January 15, continues to lend support to stocks in general, even as some economic data points painted a mixed picture.
For right now, the major directional trend remains up and, in my advisor practice, I will adjust portfolio holdings accordingly.
2. ETFs in the Spotlight
In case you missed the announcement and description of this section, you can read it here again.
It features 10 broadly diversified and sector ETFs from my HighVolume list as posted every Saturday. Furthermore, they are screened for the lowest MaxDD% number meaning they have been showing better resistance to temporary sell offs than all others over the past year.
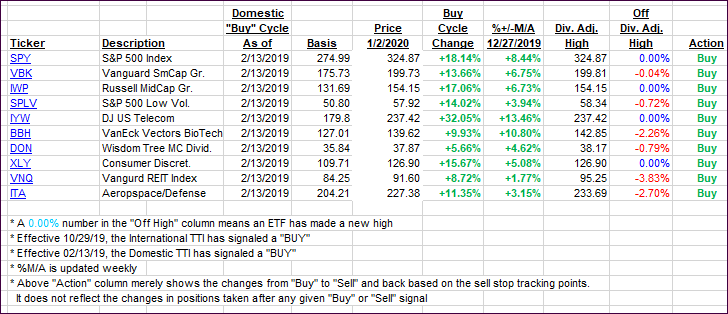
The below table simply demonstrates the magnitude with which some of the ETFs are fluctuating regarding their positions above or below their respective individual trend lines (%+/-M/A). A break below, represented by a negative number, shows weakness, while a break above, represented by a positive percentage, shows strength.
For hundreds of ETF choices, be sure to reference Thursday’s StatSheet.
For this current domestic “Buy” cycle, here’s how some our candidates have fared:
Click image to enlarge
Again, the %+/-M/A column above shows the position of the various ETFs in relation to their respective long-term trend lines, while the trailing sell stops are being tracked in the “Off High” column. The “Action” column will signal a “Sell” once the -8% point has been taken out in the “Off High” column. For more volatile sector ETFs, the trigger point is -10%.
3. Trend Tracking Indexes (TTIs)
Our Trend Tracking Indexes (TTIs) moved higher as the major indexes rallied sharply.
Here’s how we closed 01/02/2020:
Domestic TTI: +8.01% above its M/A (prior close +7.71%)—Buy signal effective 02/13/2019
International TTI: +6.97% above its M/A (prior close +6.15%)—Buy signal effective 10/29/2019
Disclosure: I am obliged to inform you that I, as well as my advisory clients, own some of the ETFs listed in the above table. Furthermore, they do not represent a specific investment recommendation for you, they merely show which ETFs from the universe I track are falling within the specified guidelines.
Contact Ulli