
- Moving the markets
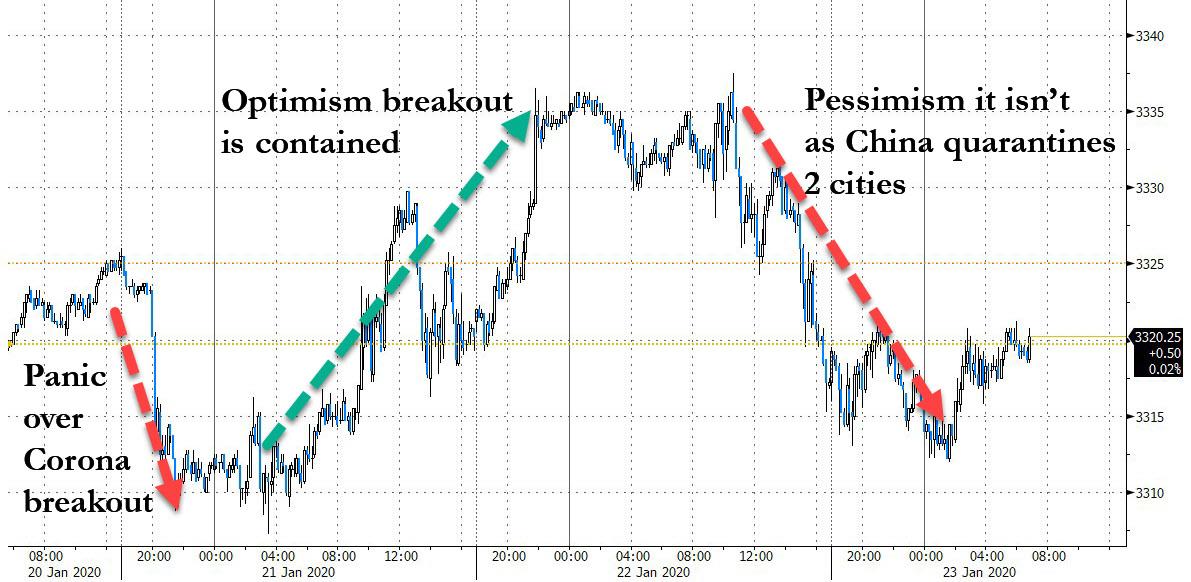
As this chart shows, news about the coronavirus played havoc with market direction over the past 3 days, with optimism causing rallies and pessimism pulling equities back down.
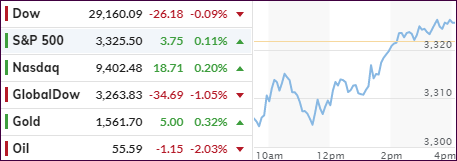
The overall impact was relatively minor so far, given the relentless march higher over the past few months. An early drop caught some support, and a slow but steady climb out of that early hole helped the major indexes to close moderately in the green, with the Dow falling just short.
Still, China continues to struggle to get a handle on the viral outbreak that has so far killed 17 people and infected 650 in several countries, according to MarketWatch. Helping the markets recover was a statement from WHO (World Health Organization) that they will not yet declare the coronavirus outbreak to be a global health emergency.
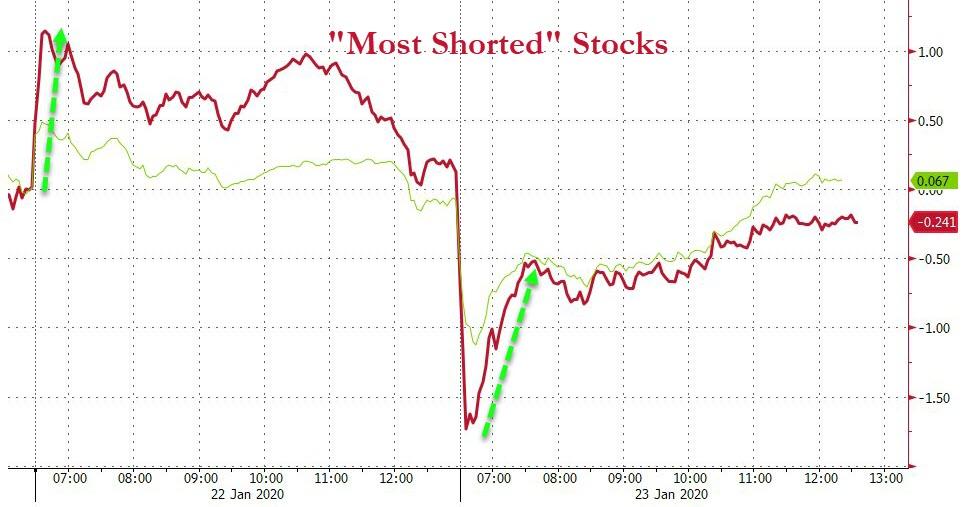
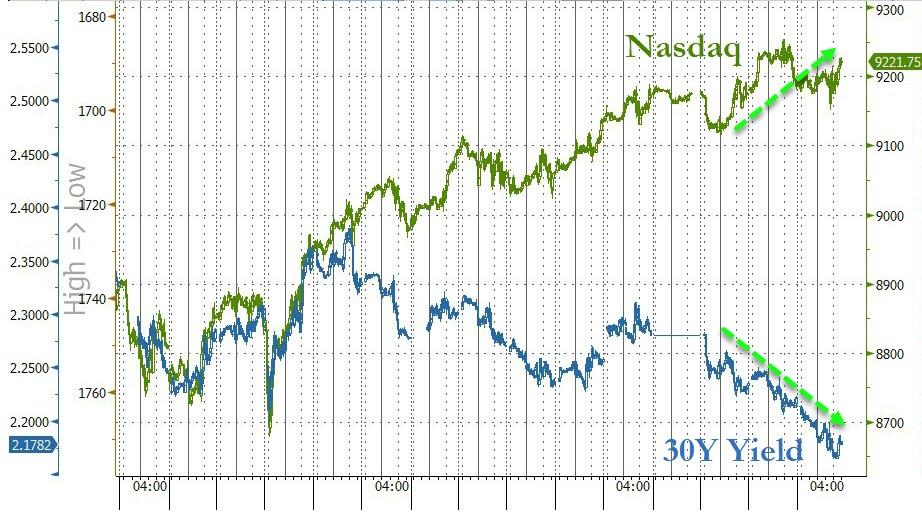
A good old-fashioned short squeeze kicked in, after the early market drop, and made its contribution to the recovery of the indexes back towards the unchanged line. As the Nasdaq touched new record highs, bond yields went the other way causing a divergence, one of the many we’ve seen over the last year, with none of them having affected equities negatively.
For right now, the major trend remains firmly in place.
2. ETFs in the Spotlight
In case you missed the announcement and description of this section, you can again.
It features 10 broadly diversified and sector ETFs from my HighVolume list as posted every Saturday. Furthermore, they are screened for the lowest MaxDD% number meaning they have been showing better resistance to temporary sell offs than all others over the past year.
The below table simply demonstrates the magnitude with which some of the ETFs are fluctuating regarding their positions above or below their respective individual trend lines (%+/-M/A). A break below, represented by a negative number, shows weakness, while a break above, represented by a positive percentage, shows strength.
For hundreds of ETF choices, be sure to reference Thursday’s StatSheet.
For this current domestic “Buy” cycle, here’s how some our candidates have fared:
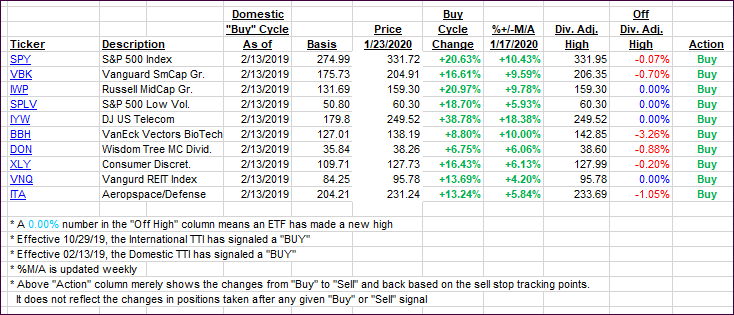
Click image to enlarge
Again, the %+/-M/A column above shows the position of the various ETFs in relation to their respective long-term trend lines, while the trailing sell stops are being tracked in the “Off High” column. The “Action” column will signal a “Sell” once the -8% point has been taken out in the “Off High” column. For more volatile sector ETFs, the trigger point is -10%.
3. Trend Tracking Indexes (TTIs)
Our Trend Tracking Indexes (TTIs) showed a mixed picture with the Domestic one gaining, while the International one slipped.
Here’s how we closed 01/23/2020:
Domestic TTI: +9.02% above its M/A (prior close +8.78%)—Buy signal effective 02/13/2019
International TTI: +6.07% above its M/A (prior close +6.51%)—Buy signal effective 10/29/2019
Disclosure: I am obliged to inform you that I, as well as my advisory clients, own some of the ETFs listed in the above table. Furthermore, they do not represent a specific investment recommendation for you, they merely show which ETFs from the universe I track are falling within the specified guidelines.
Contact Ulli