
- Moving the markets
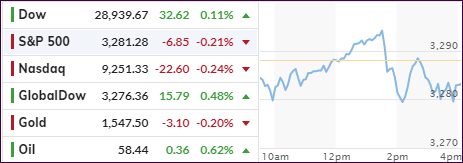
The major indexes recovered from an early slide, headed higher and touched new records, when news of trouble in the US-China deal put an end to the bullish theme and south we went.
Despite all efforts of regaining lost territory, the S&P and Nasdaq ended up moderately in the red, while the Dow was able to hang on to a green close.
Casting the shadow over the markets, and causing the mid-day stumble, were doubts about the extent of China import tariff reductions of goods coming into the U.S., which are likely to stay in place until after election time. In addition, Bloomberg reported that “any move to reduce them will hinge on Beijing’s compliance with the terms of the Phase-1 trade accord.”
That was enough for a trend reversal with the Dow losing its 29k level.
The rebound rally early on received an assist from good earnings reports by banking giants JPMorgan and Citigroup, with especially the former blowing out expectations, while Wells Fargo disappointed.
I expect to see some more bobbing and weaving in the markets, depending on the latest earnings news, and even the actual signing of the first portion of the US-China trade agreement could very well be met with a yawn and treated as a non-event.
2. ETFs in the Spotlight
In case you missed the announcement and description of this section, you can again.
It features 10 broadly diversified and sector ETFs from my HighVolume list as posted every Saturday. Furthermore, they are screened for the lowest MaxDD% number meaning they have been showing better resistance to temporary sell offs than all others over the past year.
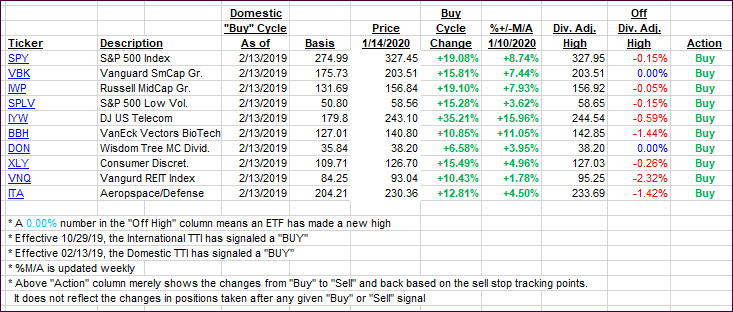
The below table simply demonstrates the magnitude with which some of the ETFs are fluctuating regarding their positions above or below their respective individual trend lines (%+/-M/A). A break below, represented by a negative number, shows weakness, while a break above, represented by a positive percentage, shows strength.
For hundreds of ETF choices, be sure to reference Thursday’s StatSheet.
For this current domestic “Buy” cycle, here’s how some our candidates have fared:
Click image to enlarge
Again, the %+/-M/A column above shows the position of the various ETFs in relation to their respective long-term trend lines, while the trailing sell stops are being tracked in the “Off High” column. The “Action” column will signal a “Sell” once the -8% point has been taken out in the “Off High” column. For more volatile sector ETFs, the trigger point is -10%.
3. Trend Tracking Indexes (TTIs)
Our Trend Tracking Indexes (TTIs) edged higher in the face of the major indexes showing weakness.
Here’s how we closed 01/14/2020:
Domestic TTI: +8.31% above its M/A (prior close +8.10%)—Buy signal effective 02/13/2019
International TTI: +6.56% above its M/A (prior close +6.66%)—Buy signal effective 10/29/2019
Disclosure: I am obliged to inform you that I, as well as my advisory clients, own some of the ETFs listed in the above table. Furthermore, they do not represent a specific investment recommendation for you, they merely show which ETFs from the universe I track are falling within the specified guidelines.
Contact Ulli