
- Moving the markets
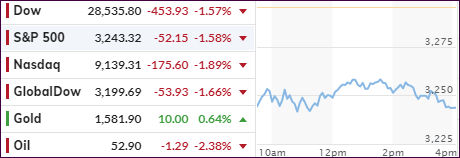
As was no surprise, more fallout from the coronavirus over the weekend made its presence felt with all markets showing red numbers. Again, given the relentless melt up since October, a correction was way overdue, and this one occurred as black swan event by coming out of nowhere and resulting in the first S&P 1%-plus loss in 76 days.
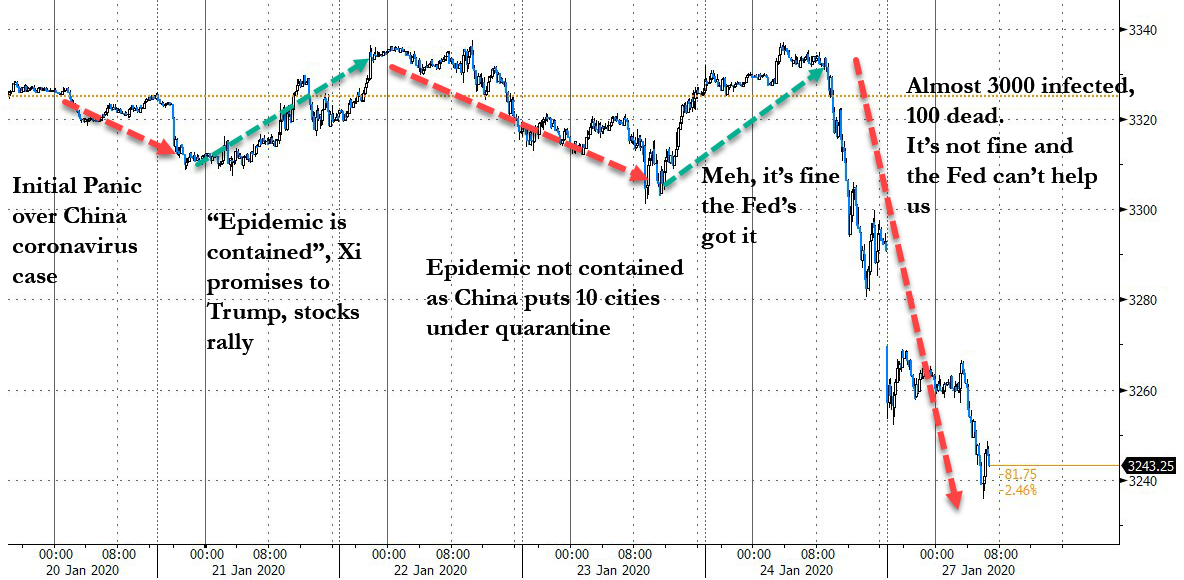
The events and subsequent market reactions were captured in this chart, with the investing crowd having now become increasingly concerned about the consequences of this virus, not only due to the obvious economic impact but also due to the severe travel restrictions involved.
The attempt to halt the spread of the virus may require more drastic measures, as the death toll had risen to more than 80 with nearly 3,000 confirmed cases of infections. Obviously, this event has taken center stage, but investors will also focus on the remainder of the earnings season, with nearly half of the Dow components being set to report results this week.
For sure, if signs emerge that the coronavirus has been contained, a huge relief rally will take center stage. If it isn’t, we will see volatility be our companion for a while, with the unanswered question being: Will this be a simple short-term correction, or the beginning of the end of this bullish cycle?
We will find out at some point and take evasive action, should the latter occur.
2. ETFs in the Spotlight
In case you missed the announcement and description of this section, you can again.
It features 10 broadly diversified and sector ETFs from my HighVolume list as posted every Saturday. Furthermore, they are screened for the lowest MaxDD% number meaning they have been showing better resistance to temporary sell offs than all others over the past year.
The below table simply demonstrates the magnitude with which some of the ETFs are fluctuating regarding their positions above or below their respective individual trend lines (%+/-M/A). A break below, represented by a negative number, shows weakness, while a break above, represented by a positive percentage, shows strength.
For hundreds of ETF choices, be sure to reference Thursday’s StatSheet.
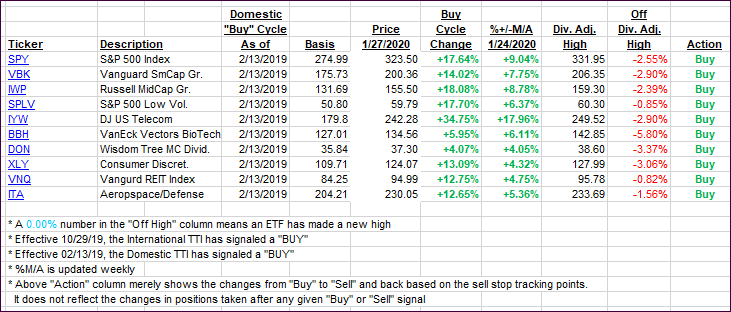
For this current domestic “Buy” cycle, here’s how some our candidates have fared:
Click image to enlarge
Again, the %+/-M/A column above shows the position of the various ETFs in relation to their respective long-term trend lines, while the trailing sell stops are being tracked in the “Off High” column. The “Action” column will signal a “Sell” once the -8% point has been taken out in the “Off High” column. For more volatile sector ETFs, the trigger point is -10%.
3. Trend Tracking Indexes (TTIs)
Our Trend Tracking Indexes (TTIs) took a dive, as the fallout from the coronavirus continued.
Here’s how we closed 01/27/2020:
Domestic TTI: +5.86% above its M/A (prior close +7.63%)—Buy signal effective 02/13/2019
International TTI: +3.84% above its M/A (prior close +5.62%)—Buy signal effective 10/29/2019
Disclosure: I am obliged to inform you that I, as well as my advisory clients, own some of the ETFs listed in the above table. Furthermore, they do not represent a specific investment recommendation for you, they merely show which ETFs from the universe I track are falling within the specified guidelines.
Contact Ulli