
ETF Tracker StatSheet
You can view the latest version here.
ENDING A POSITIVE WEEK ON A DOWN NOTE
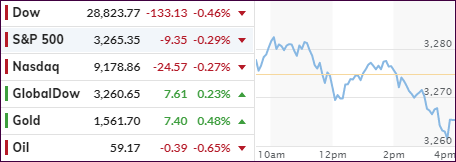
- Moving the markets
Despite the Dow touching the 29k level intra-day for the first time, there simply was not enough upward momentum left to keep the major indexes in the green, and all three of them ended up with modest losses.
However, for the week, the S&P managed to eke out an almost 1% gain, which is quite impressive given the flare up in Middle East tensions over the past weekend and into Monday.
Not helping matters today was the Labor Department’s report showing that job and wage growth was weaker than expected in December, but it did not keep the major indexes from setting new intra-day highs before slipping into the close.
The jobs report missed, as only 145k new jobs were created missing expectations of 160k, which was 111k lower than downward revised 256k last month. Manufacturing took the biggest hit, down -12k, which is its biggest drop since the summer of 2016, according to ZH.
While disappointing, many analysts believe that today’s payroll miss is unlikely to change the general economic outlook, as it’s well known that the economy is merely chugging along at a comfortable pace, while being far from overheating.
Meanwhile, all eyes are on the arrival of the Chinese delegation on Monday to complete the Phase 1 trade agreement with the U.S. While the outcome is a foregone conclusion, given history, you can never be sure, however, until all documents have actually been signed.
2. ETFs in the Spotlight
In case you missed the announcement and description of this section, you can again.
It features 10 broadly diversified and sector ETFs from my HighVolume list as posted every Saturday. Furthermore, they are screened for the lowest MaxDD% number meaning they have been showing better resistance to temporary sell offs than all others over the past year.
The below table simply demonstrates the magnitude with which some of the ETFs are fluctuating regarding their positions above or below their respective individual trend lines (%+/-M/A). A break below, represented by a negative number, shows weakness, while a break above, represented by a positive percentage, shows strength.
For hundreds of ETF choices, be sure to reference Thursday’s StatSheet.
For this current domestic “Buy” cycle, here’s how some our candidates have fared:
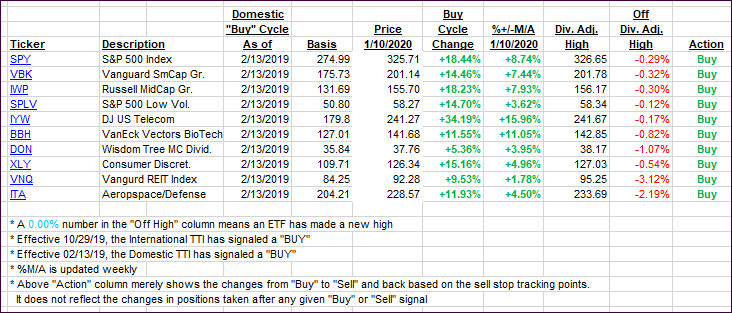
Click image to enlarge
Again, the %+/-M/A column above shows the position of the various ETFs in relation to their respective long-term trend lines, while the trailing sell stops are being tracked in the “Off High” column. The “Action” column will signal a “Sell” once the -8% point has been taken out in the “Off High” column. For more volatile sector ETFs, the trigger point is -10%.
3. Trend Tracking Indexes (TTIs)
Our Trend Tracking Indexes (TTIs) pulled back, after the major indexes made new highs and then slid into the close.
Here’s how we closed 01/10/2020:
Domestic TTI: +7.43% above its M/A (prior close +8.00%)—Buy signal effective 02/13/2019
International TTI: +6.15% above its M/A (prior close +6.56%)—Buy signal effective 10/29/2019
Disclosure: I am obliged to inform you that I, as well as my advisory clients, own some of the ETFs listed in the above table. Furthermore, they do not represent a specific investment recommendation for you, they merely show which ETFs from the universe I track are falling within the specified guidelines.
———————————————————-
WOULD YOU LIKE TO HAVE YOUR INVESTMENTS PROFESSIONALLY MANAGED?
Do you have the time to follow our investment plans yourself? If you are a busy professional who would like to have his portfolio managed using our methodology, please contact me directly or get more details here.
———————————————————
Back issues of the ETF Tracker are available on the web.
Contact Ulli