
- Moving the markets
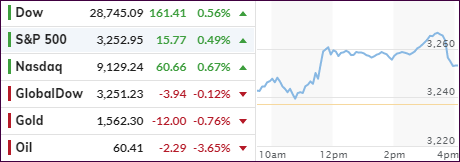
Despite a sharp sell-off overnight in the futures market, which pulled the Dow down some 400 points, the negative mood had completely changed by the time regular session bell rang.
We opened slightly higher with upward momentum gaining steam, after remarks by Trump suggested that the U.S. and the Iranian were refraining from further military action.
He further minimized Tuesday’s attack by elaborating that no U.S. casualties were sustained, and only “minimal’ damage was done to U.S. military facilities in Iraq.
In the end, the market’s initial “risk-off” reaction reversed in no time sending the S&P 500 and Nasdaq into record territory, although both indexes came off their highs and slipped into the close. On the downside, crude oil was hammered, as the de-escalation theme ruled the day.
On the economic front we learned that private sector employment data from ADP showed that 202,000 new jobs were added in December, which was above the expected number of 157,000. We’ll have to wait and see if Friday’s employment report supports that trend as well.
AS ZH posted, “from WW3 to record highs in 12 hours, as missiles flew and so did tweets and now all is well again.”
I am sure there will be more to this story, as time goes on.
2. ETFs in the Spotlight
In case you missed the announcement and description of this section, you can again.
It features 10 broadly diversified and sector ETFs from my HighVolume list as posted every Saturday. Furthermore, they are screened for the lowest MaxDD% number meaning they have been showing better resistance to temporary sell offs than all others over the past year.
The below table simply demonstrates the magnitude with which some of the ETFs are fluctuating regarding their positions above or below their respective individual trend lines (%+/-M/A). A break below, represented by a negative number, shows weakness, while a break above, represented by a positive percentage, shows strength.
For hundreds of ETF choices, be sure to reference Thursday’s StatSheet.
For this current domestic “Buy” cycle, here’s how some our candidates have fared:
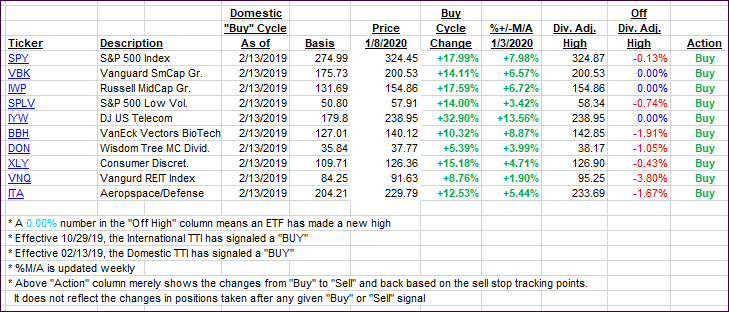
Click image to enlarge
Again, the %+/-M/A column above shows the position of the various ETFs in relation to their respective long-term trend lines, while the trailing sell stops are being tracked in the “Off High” column. The “Action” column will signal a “Sell” once the -8% point has been taken out in the “Off High” column. For more volatile sector ETFs, the trigger point is -10%.
3. Trend Tracking Indexes (TTIs)
Our Trend Tracking Indexes (TTIs) were mixed with the Domestic one popping nicely, while the International one slipped a fraction.
Here’s how we closed 01/08/2020:
Domestic TTI: +7.51% above its M/A (prior close +7.20%)—Buy signal effective 02/13/2019
International TTI: +6.00% above its M/A (prior close +6.01%)—Buy signal effective 10/29/2019
Disclosure: I am obliged to inform you that I, as well as my advisory clients, own some of the ETFs listed in the above table. Furthermore, they do not represent a specific investment recommendation for you, they merely show which ETFs from the universe I track are falling within the specified guidelines.
Contact Ulli