
- Moving the markets
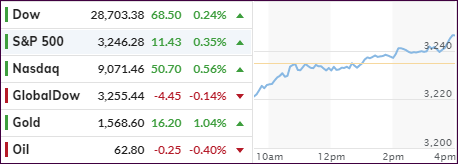
Despite the escalating tensions in the Middle East, the markets appeared to be looking past the beating of the war drums and dug themselves out of an early hole. The initial dump did not hold, and a slow but steady ascent towards the unchanged line was followed by a late burst to assure a green close for the major indexes.
The appetite for stocks had been somewhat tempered over the past few trading days due to the unknown implications of the death of the Iranian general last week. This uncertainty was supported by higher oil prices and fears what the global fallout might be, should the Iranians close the Straits of Hormuz.
However, overriding these issues is the fact that the assumed to be all powerful Fed will continue their accommodative monetary policy in 2020, despite the US being almost certain to get the Phase-1 trade deal with China signed, which is to be finalized by January 15.
Despite likely occasional market sell-offs, the general environment for equities leading up to the election looks positive, that is, until a Black Swan event causes the major market trend to change from bullish to bearish, which then will be the time to apply our exit strategy and head for the safety of the sidelines.
2. ETFs in the Spotlight
In case you missed the announcement and description of this section, you can again.
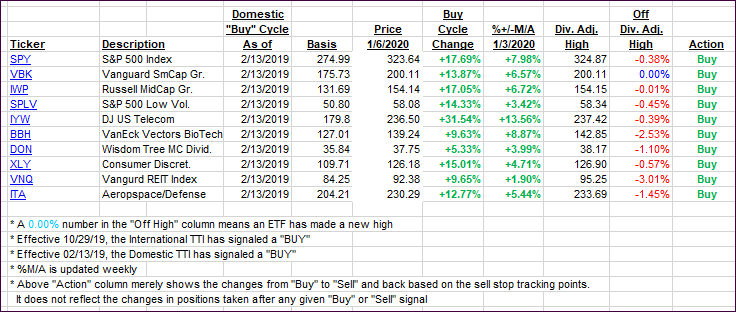
It features 10 broadly diversified and sector ETFs from my HighVolume list as posted every Saturday. Furthermore, they are screened for the lowest MaxDD% number meaning they have been showing better resistance to temporary sell offs than all others over the past year.
The below table simply demonstrates the magnitude with which some of the ETFs are fluctuating regarding their positions above or below their respective individual trend lines (%+/-M/A). A break below, represented by a negative number, shows weakness, while a break above, represented by a positive percentage, shows strength.
For hundreds of ETF choices, be sure to reference Thursday’s StatSheet.
For this current domestic “Buy” cycle, here’s how some our candidates have fared:
Click image to enlarge
Again, the %+/-M/A column above shows the position of the various ETFs in relation to their respective long-term trend lines, while the trailing sell stops are being tracked in the “Off High” column. The “Action” column will signal a “Sell” once the -8% point has been taken out in the “Off High” column. For more volatile sector ETFs, the trigger point is -10%.
3. Trend Tracking Indexes (TTIs)
Our Trend Tracking Indexes (TTIs) were mixed with the domestic one gaining, while the International declined slightly.
Here’s how we closed 01/06/2020:
Domestic TTI: +7.29% above its M/A (prior close +7.15%)—Buy signal effective 02/13/2019
International TTI: +6.15% above its M/A (prior close +6.25%)—Buy signal effective 10/29/2019
Disclosure: I am obliged to inform you that I, as well as my advisory clients, own some of the ETFs listed in the above table. Furthermore, they do not represent a specific investment recommendation for you, they merely show which ETFs from the universe I track are falling within the specified guidelines.
Contact Ulli