
- Moving the markets
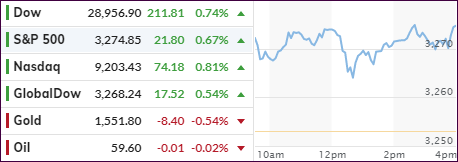
After the opening bell, the major indexes continued their attack into record territory, as the attention moved from Iran to the latest in the U.S.-China trade agreement.
It appeared that the tensions in the Middle East eased somewhat, as the war rhetoric seemed to have slowed down, or at least has been put on the back burner for the time being. Trump’s comments yesterday that he wasn’t pushing for an all-out war with Iran, was a relief for traders and resulted in a continuation of the rebound.
The trade deal now took front and center again with China’s Vice Premier He scheduled to lead a delegation to Washington next week to sign the Phase 1 agreement, which supported the current bullish market mood.
In the meantime, the Fed’s vice chairman Clarida announced that the economy “was on solid ground,” but emphasized that the Fed’s interest rate policy may be changed at any meeting. Surprisingly, this statement did not have a negative market moving effect.
In the end, the major indexes melted up again with the S&P’s forward PE now at 18.5x, which is its highest since the dotcom bust, according to ZH.
It simply confirms that fundamental evaluations no longer matter, until one day, they do. Until then, what matters are the coordinated efforts by the Central Banks to maintain low to negative interest rates and making sure an abundance of liquidity, AKA the #1 market driver, is always available.
2. ETFs in the Spotlight
In case you missed the announcement and description of this section, you can again.
It features 10 broadly diversified and sector ETFs from my HighVolume list as posted every Saturday. Furthermore, they are screened for the lowest MaxDD% number meaning they have been showing better resistance to temporary sell offs than all others over the past year.
The below table simply demonstrates the magnitude with which some of the ETFs are fluctuating regarding their positions above or below their respective individual trend lines (%+/-M/A). A break below, represented by a negative number, shows weakness, while a break above, represented by a positive percentage, shows strength.
For hundreds of ETF choices, be sure to reference Thursday’s StatSheet.
For this current domestic “Buy” cycle, here’s how some our candidates have fared:
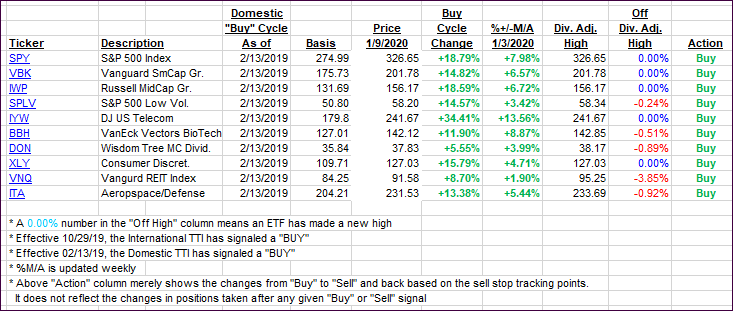
Click image to enlarge
Again, the %+/-M/A column above shows the position of the various ETFs in relation to their respective long-term trend lines, while the trailing sell stops are being tracked in the “Off High” column. The “Action” column will signal a “Sell” once the -8% point has been taken out in the “Off High” column. For more volatile sector ETFs, the trigger point is -10%.
3. Trend Tracking Indexes (TTIs)
Our Trend Tracking Indexes (TTIs) jumped with the major indexes setting new record highs on an intra-day basis.
Here’s how we closed 01/09/2020:
Domestic TTI: +8.00% above its M/A (prior close +7.51%)—Buy signal effective 02/13/2019
International TTI: +6.56% above its M/A (prior close +6.00%)—Buy signal effective 10/29/2019
Disclosure: I am obliged to inform you that I, as well as my advisory clients, own some of the ETFs listed in the above table. Furthermore, they do not represent a specific investment recommendation for you, they merely show which ETFs from the universe I track are falling within the specified guidelines.
Contact Ulli