
- Moving the markets
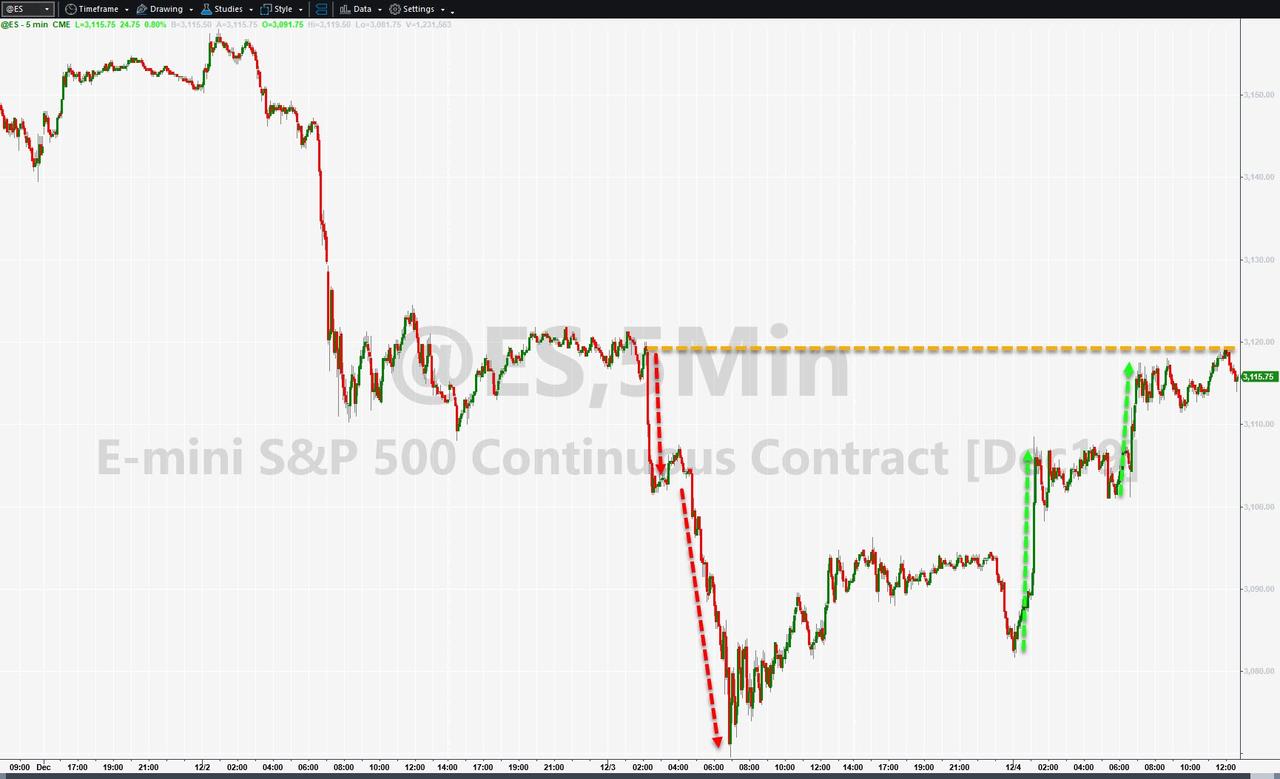
Today was reversal day, as the trade soap opera story was changed again based on an unsourced rumor that a phase-1 deal was still in the works. Even though nothing of substance was offered, it was enough hope for the computer algos to shift in reverse and pull the markets out of the doldrums.
One analyst summed up the trade story like this:
President Trump stated he is in no rush and “in some ways I think it’s better to wait until after the election” to make a trade deal with China. Not September, as we were told by those ‘in the know’ at certain financial media; not October, as were again told; not November, as we were still told; and not December, and perhaps not early 2020 – but after the US presidential election….which might as well be forever for markets.
Especially as Trump will not have any electoral concerns at that point so might just dump the whole idea and go ‘all-in’. Indeed, Commerce Secretary Ross also made clear if “substantial progress” isn’t seen soon then the final 15% tariff tranche is indeed going to happen on 15 December.
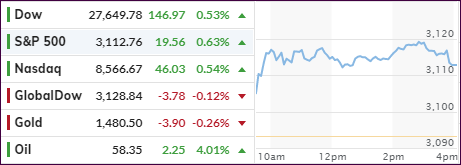
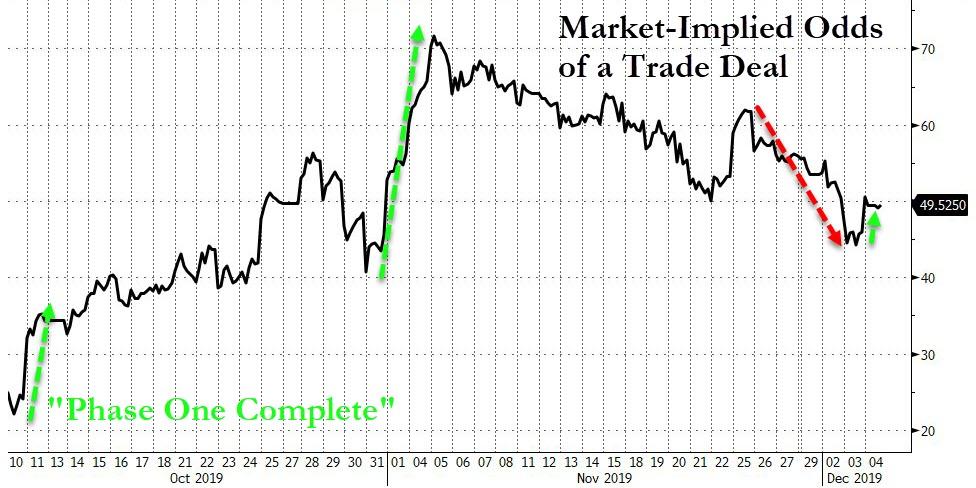
And so, the saga goes on. The major indexes popped nicely but gave back some of their early gains, as momentum faded into the close. The market-implied odds of a trade deal rebounded and are now at about 50/50, which is more or less a coin-flip, while they were at 70% just in early November, according to ZH.
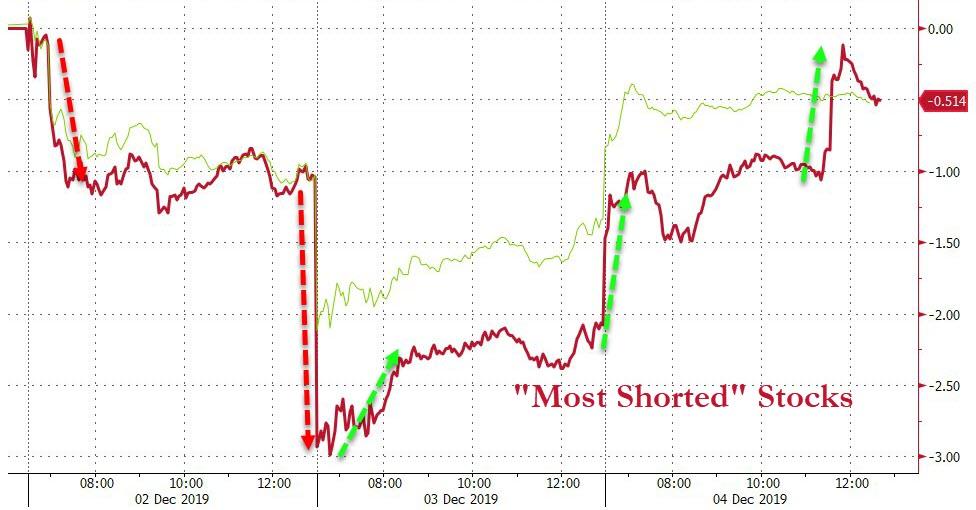
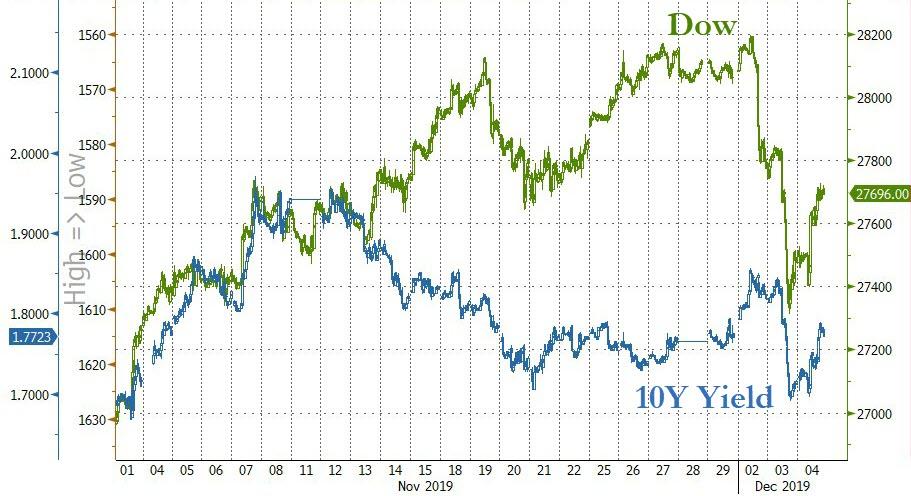
Helping today’s rebound was a double whammy short squeeze, while the decoupling of stocks and bonds, which I posted yesterday, continued despite stocks almost touching the 10-year bond yield, which gained 5.3 basis points to end the day at 1.772%.
Since the Fed has made its policy of lower interest rates clear, the stock indexes are now dependent on the latest rumors from the trade front. And I am sure, they will continue to be full of surprises.
2. ETFs in the Spotlight
In case you missed the announcement and description of this section, you can read it here again.
It features 10 broadly diversified and sector ETFs from my HighVolume list as posted every Saturday. Furthermore, they are screened for the lowest MaxDD% number meaning they have been showing better resistance to temporary sell offs than all others over the past year.
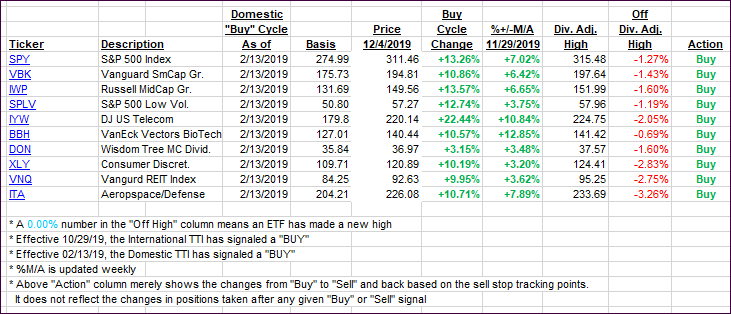
The below table simply demonstrates the magnitude with which some of the ETFs are fluctuating regarding their positions above or below their respective individual trend lines (%+/-M/A). A break below, represented by a negative number, shows weakness, while a break above, represented by a positive percentage, shows strength.
For hundreds of ETF choices, be sure to reference Thursday’s StatSheet.
For this current domestic “Buy” cycle, here’s how some our candidates have fared:
Click image to enlarge
Again, the %+/-M/A column above shows the position of the various ETFs in relation to their respective long-term trend lines, while the trailing sell stops are being tracked in the “Off High” column. The “Action” column will signal a “Sell” once the -8% point has been taken out in the “Off High” column. For more volatile sector ETFs, the trigger point is -10%.
3. Trend Tracking Indexes (TTIs)
Our Trend Tracking Indexes (TTIs) shifted in reverse and closed higher.
Here’s how we closed 12/4/2019:
Domestic TTI: +5.17% above its M/A (prior close +4.41%)—Buy signal effective 02/13/2019
International TTI: +2.97% above its M/A (prior close +2.32%)—Buy signal effective 10/29/2019
Disclosure: I am obliged to inform you that I, as well as my advisory clients, own some of the ETFs listed in the above table. Furthermore, they do not represent a specific investment recommendation for you, they merely show which ETFs from the universe I track are falling within the specified guidelines.
Contact Ulli