
- Moving the markets
It’s amazing what little it takes to send the computer algos on a bullish run and in the process pushing the major indexes into record territory.
Trump’s announcement that “a big deal” with China is “getting very close” and “they want it, and so do we” were the magic words that ramped equities into uncharted territory. Traders assumed that also meant that the fresh tariffs scheduled to go in effect on Sunday may be avoided.
Then another report confirmed that the US team is indeed offering to cancel the new tariffs and reduce existing levies on Chinese goods by up to 50% on $360 billion worth of imports.
One analyst did not see any meat on that bone for the U.S. and summed it up like this:
So, what does Trump get in return for folding like a cheap chair? Why pledges to buy more agricultural products, pledges which apparently are not even enforceable as they are merely “firm commitments”, in other words taking China for its word.
Of course, we’ve heard all of this before, as one analyst succinctly tweeted. There is no doubt that eventually a deal be struck, but will it be this time or is this simply another attempt to positively influence the markets?
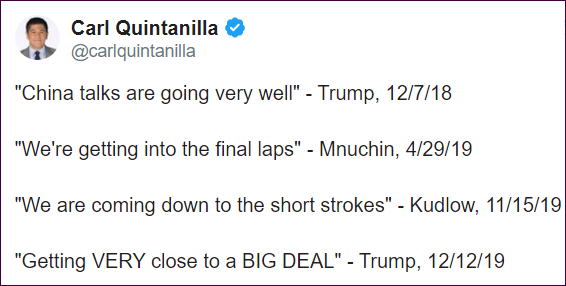
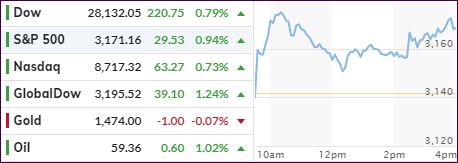
Mid-day, some questionable news from the Chinese took the starch out of upward momentum, but the major indexes recovered from the pullback, as words that “a trade deal in principle” had been reached, seemed to calm things down, and we closed solidly in the green.
Bondholders got punished today, as yields rocketed higher with the 30-year soaring the most in 3 months, while the 10-year rose 9.3 basis points to close at 1.89%.
Looking at the big picture in the markets and considering the worsening repo issues (overnight lending), the possibility of QE4 from the Fed and the ever entertaining and ongoing trade saga with China, it promises to be an interesting last 2 weeks of 2019.
2. ETFs in the Spotlight
In case you missed the announcement and description of this section, you can read it here again.
It features 10 broadly diversified and sector ETFs from my HighVolume list as posted every Saturday. Furthermore, they are screened for the lowest MaxDD% number meaning they have been showing better resistance to temporary sell offs than all others over the past year.
The below table simply demonstrates the magnitude with which some of the ETFs are fluctuating regarding their positions above or below their respective individual trend lines (%+/-M/A). A break below, represented by a negative number, shows weakness, while a break above, represented by a positive percentage, shows strength.
For hundreds of ETF choices, be sure to reference Thursday’s StatSheet.
For this current domestic “Buy” cycle, here’s how some our candidates have fared:
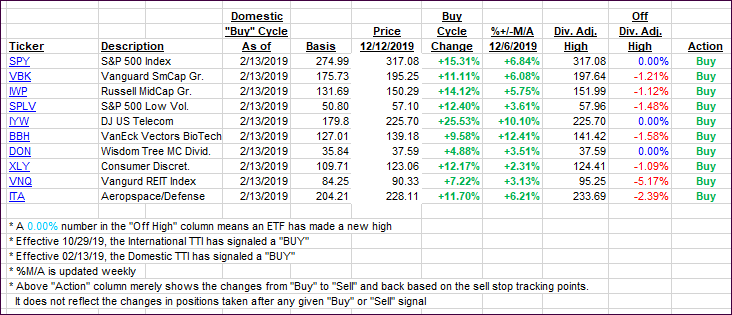
Click image to enlarge
Again, the %+/-M/A column above shows the position of the various ETFs in relation to their respective long-term trend lines, while the trailing sell stops are being tracked in the “Off High” column. The “Action” column will signal a “Sell” once the -8% point has been taken out in the “Off High” column. For more volatile sector ETFs, the trigger point is -10%.
3. Trend Tracking Indexes (TTIs)
Our Trend Tracking Indexes (TTIs) jumped as the US-China trade situation received positive press.
Here’s how we closed 12/12/2019:
Domestic TTI: +6.98% above its M/A (prior close +5.87%)—Buy signal effective 02/13/2019
International TTI: +4.97% above its M/A (prior close +4.18%)—Buy signal effective 10/29/2019
Disclosure: I am obliged to inform you that I, as well as my advisory clients, own some of the ETFs listed in the above table. Furthermore, they do not represent a specific investment recommendation for you, they merely show which ETFs from the universe I track are falling within the specified guidelines.
Contact Ulli