

- Moving the markets
Just as I posted the amazing fact last Wednesday that the S&P 500 had not corrected more than -0.5% in 35 days, it happened suddenly with the index shedding a moderate -0.86%.
The markets got hit right at the opening with a one-two punch in form of a worse-than-expected manufacturing report and mixed comments on the latest involving the US-China trade tensions.
The ISM manufacturing index dropped to 48.1% from 48.3% in October against expectations of an overly optimistic 49.2%. Readings below 50% indicate that business conditions are getting worse.
AS ZH reports, a quadruple whammy of not-awesome trade related comments gave an assist to the bears:
- 0602ET *TRUMP TO RESTORE TARIFF ON STEEL SHIPPED FROM BRAZIL, ARGENTINA
- 1035ET *TRUMP WILL INCREASE TARIFFS IF NO CHINA DEAL, ROSS TELLS FOX
- 1200ET *TRUMP AIDE SAYS IT’S UP TO CHINA IF DEAL WILL BE MADE THIS YR
- 1230ET *CHINA TO RELEASE ‘UNRELIABLE ENTITY LIST’: GLOBAL TIMES
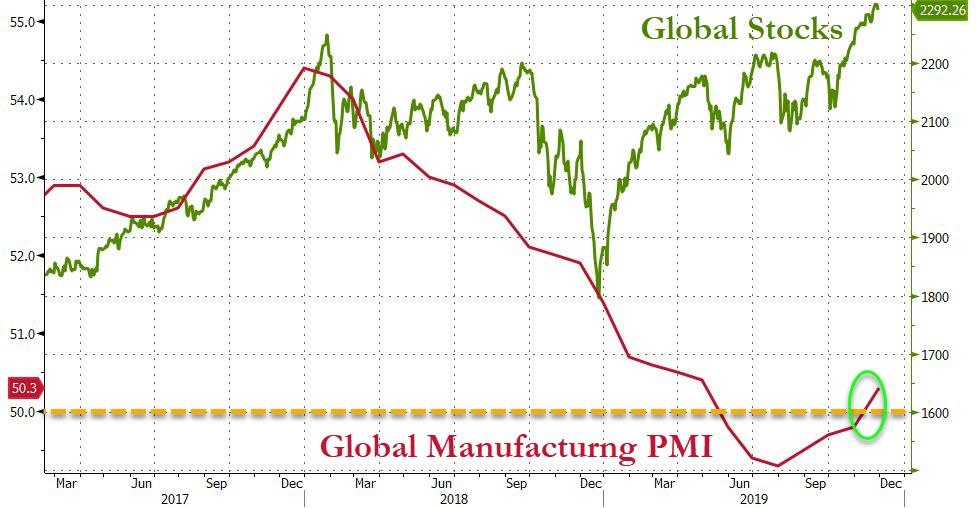
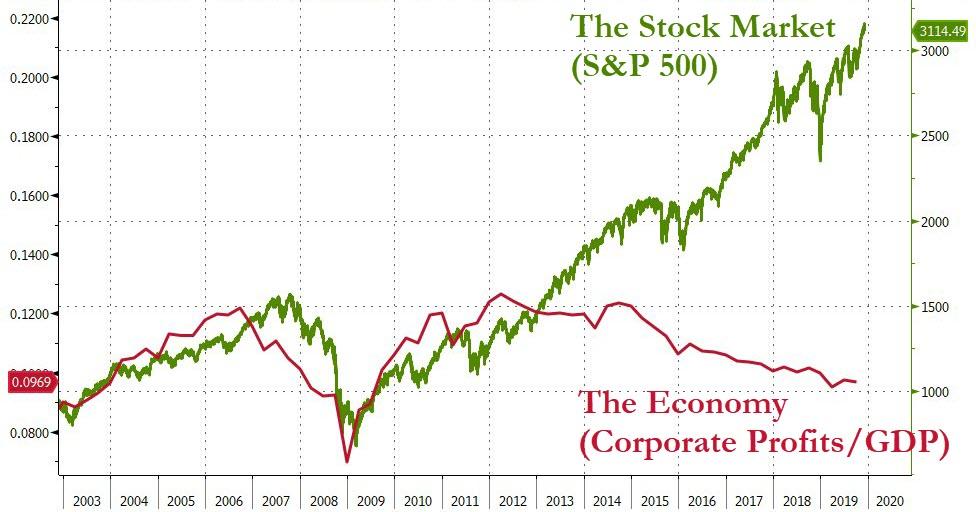
As a result, domestic equities were spanked and suffered their biggest drop in 6 weeks. As I commented on many occasions, not only does the global economy look murky at best, the US is not much better, as this chart shows.
On the other hand, the pullback was mild compared to the recent gains, and the bulls may have more to smile about, once the White House fires the next verbal salvo about how well phase 1 and 2 of the trade deal are progressing. Wait for it…
2. ETFs in the Spotlight
In case you missed the announcement and description of this section, you can t again.
It features 10 broadly diversified and sector ETFs from my HighVolume list as posted every Saturday. Furthermore, they are screened for the lowest MaxDD% number meaning they have been showing better resistance to temporary sell offs than all others over the past year.
The below table simply demonstrates the magnitude with which some of the ETFs are fluctuating regarding their positions above or below their respective individual trend lines (%+/-M/A). A break below, represented by a negative number, shows weakness, while a break above, represented by a positive percentage, shows strength.
For hundreds of ETF choices, be sure to reference Thursday’s StatSheet.
For this current domestic “Buy” cycle, here’s how some our candidates have fared:
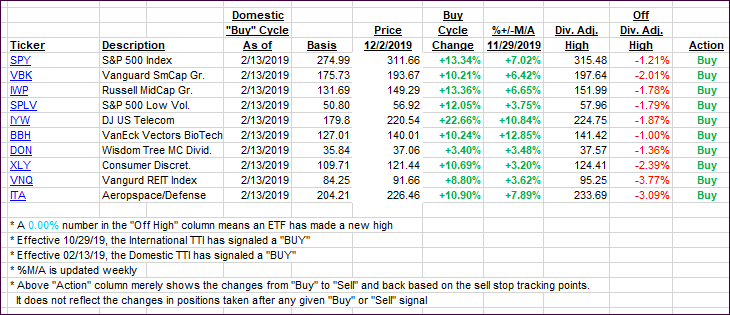
Again, the %+/-M/A column above shows the position of the various ETFs in relation to their respective long-term trend lines, while the trailing sell stops are being tracked in the “Off High” column. The “Action” column will signal a “Sell” once the -8% point has been taken out in the “Off High” column. For more volatile sector ETFs, the trigger point is -10%.
3. Trend Tracking Indexes (TTIs)
Our Trend Tracking Indexes (TTIs) retreated as trade along with economic news disappointed.
Here’s how we closed 12/2/2019:
Domestic TTI: +5.26% above its M/A (prior close +6.16%)—Buy signal effective 02/13/2019
International TTI: +3.14% above its M/A (prior close +3.70%)—Buy signal effective 10/29/2019
Disclosure: I am obliged to inform you that I, as well as my advisory clients, own some of the ETFs listed in the above table. Furthermore, they do not represent a specific investment recommendation for you, they merely show which ETFs from the universe I track are falling within the specified guidelines.
Contact Ulli