
- Moving the markets
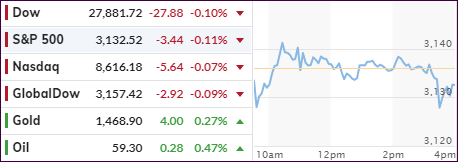
Bobbing and weaving best describes today’s session with the major indexes being stuck in a sideways pattern after rebounding from an early dip.
The latest news from the US-China trade debacle points to some progress in that trade negotiators are “laying the groundwork for a delay” of the new 15% import tariffs scheduled to be implemented this coming Sunday.
Meanwhile, the Fed started its 2-day policy meeting with the results being announced tomorrow. Expectations are that interest rates will be held steady. Of concern is Fed chief Powell’s intention of forging consensus towards a “broader revamp of the Fed rate-setting strategy.”
Translated, that means he is favor of letting inflation run above its annual 2% target. To my way of thinking, how can that end well? It’s not that the Fed has a magic wand to rein in inflation, should it suddenly burst out of control. Apparently, historic precedents as to the potentially devastating effects of inflation, such as we’ve seen during the Weimar Republic, are simply ignored.
Adding to this issue is the fact that we are living in a deficit-based spending environment where debt and deficits are soaring relentlessly higher. While these problems have been largely ignored, and are never addressed on any political platform, they represent a piper that eventually will need to get paid.
In the meantime, the markets went nowhere today with the major indexes hugging their respective unchanged lines and slipping slightly in the red.
In the underlying overnight lending market (repos), the troubles continue with liquidity being conspicuously absent. We’ll have to wait and see, if there will be a fallout by the end of this year that could affect equities.
2. ETFs in the Spotlight
In case you missed the announcement and description of this section, you can read it here again.
It features 10 broadly diversified and sector ETFs from my HighVolume list as posted every Saturday. Furthermore, they are screened for the lowest MaxDD% number meaning they have been showing better resistance to temporary sell offs than all others over the past year.
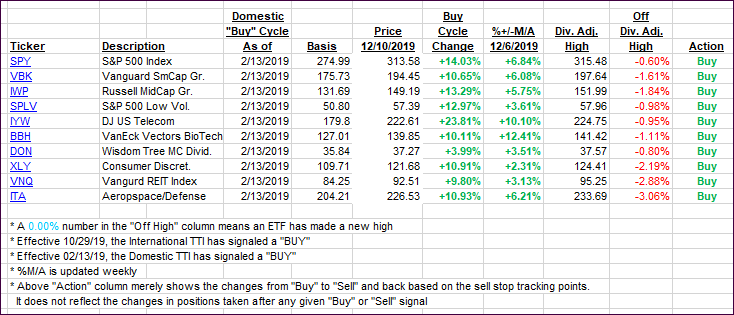
The below table simply demonstrates the magnitude with which some of the ETFs are fluctuating regarding their positions above or below their respective individual trend lines (%+/-M/A). A break below, represented by a negative number, shows weakness, while a break above, represented by a positive percentage, shows strength.
For hundreds of ETF choices, be sure to reference Thursday’s StatSheet.
For this current domestic “Buy” cycle, here’s how some our candidates have fared:
Click image to enlarge
Again, the %+/-M/A column above shows the position of the various ETFs in relation to their respective long-term trend lines, while the trailing sell stops are being tracked in the “Off High” column. The “Action” column will signal a “Sell” once the -8% point has been taken out in the “Off High” column. For more volatile sector ETFs, the trigger point is -10%.
3. Trend Tracking Indexes (TTIs)
Our Trend Tracking Indexes (TTIs) gave back a tad as the market direction was predominantly sideways.
Here’s how we closed 12/10/2019:
Domestic TTI: +5.56% above its M/A (prior close +5.67%)—Buy signal effective 02/13/2019
International TTI: +3.72% above its M/A (prior close +3.83%)—Buy signal effective 10/29/2019
Disclosure: I am obliged to inform you that I, as well as my advisory clients, own some of the ETFs listed in the above table. Furthermore, they do not represent a specific investment recommendation for you, they merely show which ETFs from the universe I track are falling within the specified guidelines.
Contact Ulli