
ETF Tracker StatSheet
You can view the latest version here.
JOBS REPORT POWERS MARKETS—THE WEEK ENDS UP UNCHANGED
- Moving the markets
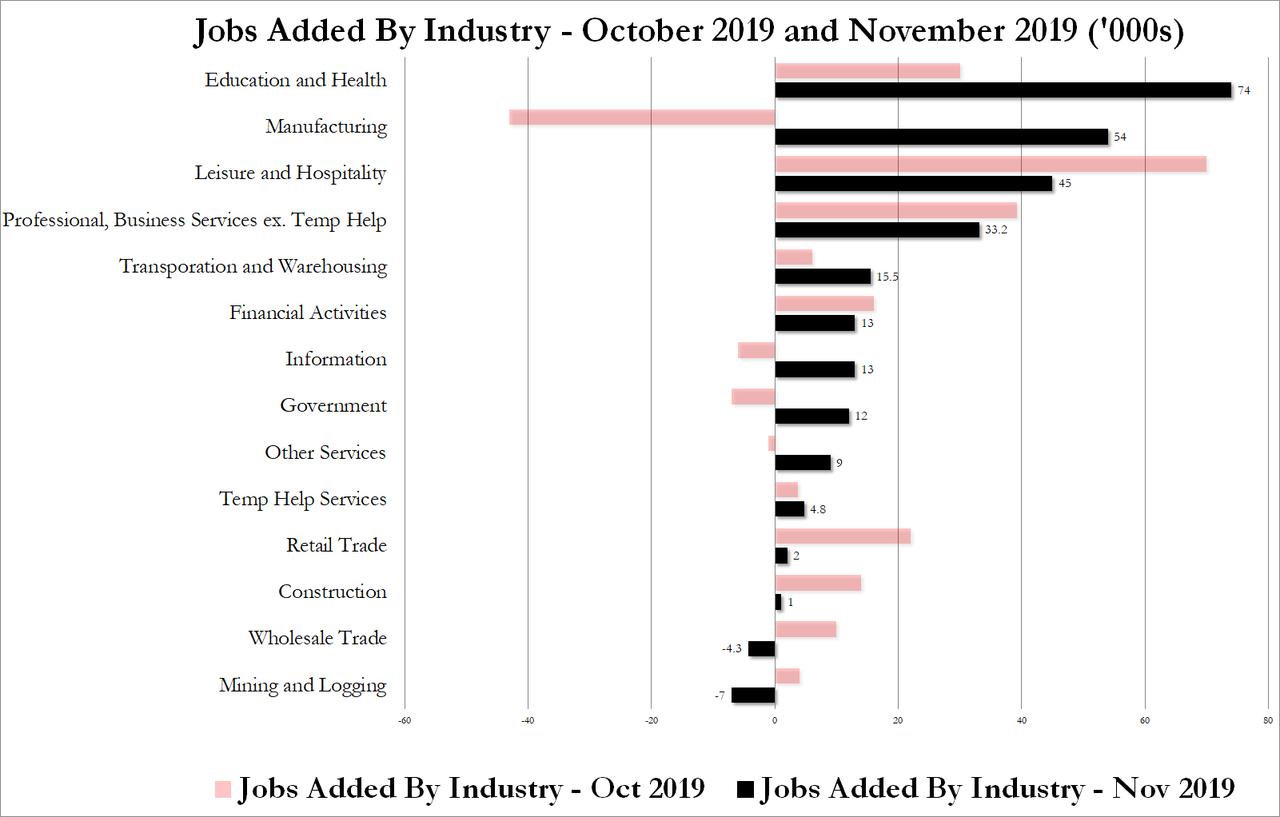
The headline jobs report did not disappoint and showed that 266k new jobs were created vs. 180k expected, while the unemployment rate dipped to 3.5%.
As I keep mentioning, it’s only the headline number that matters, because it forms the basis for the computer algos to ‘buy’ or ‘sell.’ When looking under the hood, we saw a one-time surge in manufacturing workers, with 54k being added in November, which was the most in over two decades. However, nearly all of those were the result of 41k striking GM workers returning to their jobs.
In other words, the November surge was simply an offset to the 43k slide in October. But those details don’t matter in today’s environment, since only headlines are the driver of markets.
Still, healthcare along with leisure and hospitality were on top of the list showing solid gains. With the latest jobs report also came the revisions for the prior two months, which showed an increase in jobs from what was originally reported.
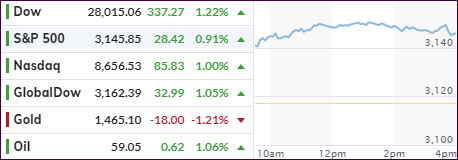
It was wild rollercoaster of a week, which started ugly with two days of selloffs, as the S&P experienced its worst December start since 2008. Optimistic trade news was chased by pessimistic ones leaving the markets in limbo until today’s jobs report restored bullish upward momentum. The S&P 500 only gained a meager 5 points since last Friday, but it was a remarkable recovery given where the index was at.
ZH added this for color:
There was another reason for the return of the stock rally: this week the Fed’s balance sheet rose once again, and as we have shown, in the past 9 weeks ever since the Fed resumed repos and eventually POMO, the stock market is up every single week when the Fed’s balance sheet is higher; the only week the S&P was lower was when the Fed’s balance sheet also shrank. Surely, it’s just a coincidence…
And then this:
So, after this week’s fireworks is it now safe to assume that stocks won’t deliver any more major surprises for the balance of 2019? Keep an eye on the Dec 15 tariff deadline: because today’s super strong job number merely assured that Trump now thinks he has even more leverage to demand concessions from China, while the Fed’s fears that trade war is hurting the economy and thus has to be vigilant to the downside, were blown away. Finally, this was and remains a market where one Trump tweet can mean the difference between a successful and catastrophic year for countless traders, and something tells us the coming three weeks, which see both the culmination of trade discussions and Trump’s impeachment, will be anything but quiet.
Based on the above, I believe that volatility is bound to pick up again, something the bears will be excited to see. However, when looking at the longer term, the fact that the Fed, along with the other global banks, is set to continue with its money printing efforts to monetize the debt, and solve the ever growing issues with the overnight repo operations, the resulting liquidity is bound to flow into the stock market thereby supporting the bullish scenario.
2. ETFs in the Spotlight
In case you missed the announcement and description of this section, you can read it here again.
It features 10 broadly diversified and sector ETFs from my HighVolume list as posted every Saturday. Furthermore, they are screened for the lowest MaxDD% number meaning they have been showing better resistance to temporary sell offs than all others over the past year.
The below table simply demonstrates the magnitude with which some of the ETFs are fluctuating regarding their positions above or below their respective individual trend lines (%+/-M/A). A break below, represented by a negative number, shows weakness, while a break above, represented by a positive percentage, shows strength.
For hundreds of ETF choices, be sure to reference Thursday’s StatSheet.
For this current domestic “Buy” cycle, here’s how some our candidates have fared:
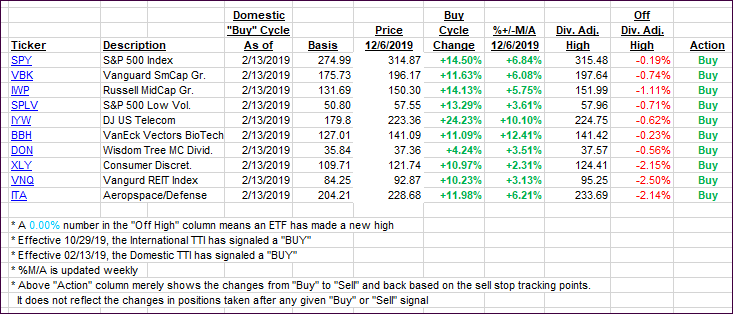
Click image to enlarge
Again, the %+/-M/A column above shows the position of the various ETFs in relation to their respective long-term trend lines, while the trailing sell stops are being tracked in the “Off High” column. The “Action” column will signal a “Sell” once the -8% point has been taken out in the “Off High” column. For more volatile sector ETFs, the trigger point is -10%.
3. Trend Tracking Indexes (TTIs)
Our Trend Tracking Indexes (TTIs) jumped as the jobs report powered the markets today.
Here’s how we closed 12/5/2019:
Domestic TTI: +6.00% above its M/A (prior close +5.35%)—Buy signal effective 02/13/2019
International TTI: +3.88% above its M/A (prior close +3.17%)—Buy signal effective 10/29/2019
Disclosure: I am obliged to inform you that I, as well as my advisory clients, own some of the ETFs listed in the above table. Furthermore, they do not represent a specific investment recommendation for you, they merely show which ETFs from the universe I track are falling within the specified guidelines.
———————————————————-
WOULD YOU LIKE TO HAVE YOUR INVESTMENTS PROFESSIONALLY MANAGED?
Do you have the time to follow our investment plans yourself? If you are a busy professional who would like to have his portfolio managed using our methodology, please contact me directly or get more details here.
———————————————————
Back issues of the ETF Tracker are available on the web.
Contact Ulli