
ETF Tracker StatSheet
You can view the latest version here.
SANTA CLAUS RALLY CONTINUES
- Moving the markets
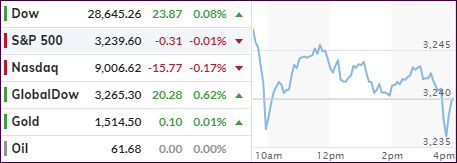
The markets continued their torrid pace into record territory, although momentum faded into the close today with the S&P 500 slipping just a tad but closing higher by +0.59% during this Holiday-shortened week.
As ZH pointed out, it’s been a year of buying everything:
- S&P’s best year since 1997
- Gold’s best year since 2010
- Bond’s best year since 2014
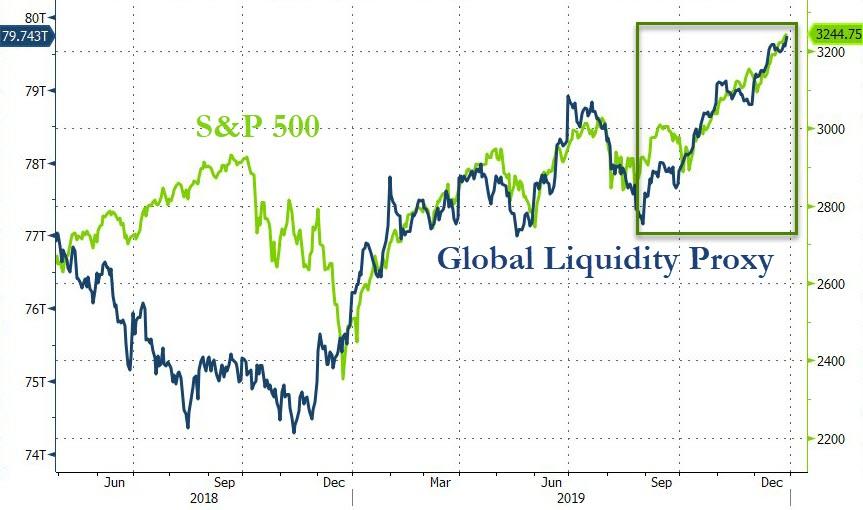
Of course, as I mentioned ad nauseum, the magic behind this rally was the largesse of not only the Fed but Central Banks in general, who for 2019 provided some $5 trillion dollars in liquidity, as interest rates traveled towards negative territory.
Presidential candidate Trump seemed to recognize this abnormality when back on 9/5/16, he said:
“They’re keeping the rates down so that everything else doesn’t go down… The only thing that is strong is the artificial stock market.”
That also explains how the S&P 500 can be up almost 30%, while earnings expectations are down almost 5% on the year, as ZH elaborates.
Be that as it may, the bullish trend remains firmly in place, and we will stay abord until that fact changes.
2. ETFs in the Spotlight
In case you missed the announcement and description of this section, you can read it here again.
It features 10 broadly diversified and sector ETFs from my HighVolume list as posted every Saturday. Furthermore, they are screened for the lowest MaxDD% number meaning they have been showing better resistance to temporary sell offs than all others over the past year.
The below table simply demonstrates the magnitude with which some of the ETFs are fluctuating regarding their positions above or below their respective individual trend lines (%+/-M/A). A break below, represented by a negative number, shows weakness, while a break above, represented by a positive percentage, shows strength.
For hundreds of ETF choices, be sure to reference Thursday’s StatSheet.
For this current domestic “Buy” cycle, here’s how some our candidates have fared:
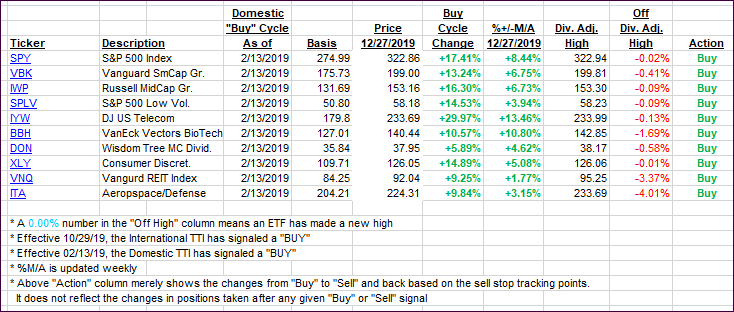
Click image to enlarge
Again, the %+/-M/A column above shows the position of the various ETFs in relation to their respective long-term trend lines, while the trailing sell stops are being tracked in the “Off High” column. The “Action” column will signal a “Sell” once the -8% point has been taken out in the “Off High” column. For more volatile sector ETFs, the trigger point is -10%.
3. Trend Tracking Indexes (TTIs)
Our Trend Tracking Indexes (TTIs) only moved a tad, as the major indexes faded into the close.
Here’s how we closed 12/26/2019:
Domestic TTI: +7.68% above its M/A (prior close +7.48%)—Buy signal effective 02/13/2019
International TTI: +6.62% above its M/A (prior close +6.24%)—Buy signal effective 10/29/2019
Disclosure: I am obliged to inform you that I, as well as my advisory clients, own some of the ETFs listed in the above table. Furthermore, they do not represent a specific investment recommendation for you, they merely show which ETFs from the universe I track are falling within the specified guidelines.
———————————————————-
WOULD YOU LIKE TO HAVE YOUR INVESTMENTS PROFESSIONALLY MANAGED?
Do you have the time to follow our investment plans yourself? If you are a busy professional who would like to have his portfolio managed using our methodology, please contact me directly or get more details here.
———————————————————
Back issues of the ETF Tracker are available on the web.
Contact Ulli