
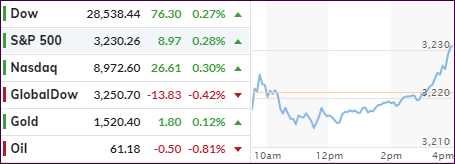
- Moving the markets
Despite the major indexes hovering below their respective unchanged lines for most of the session, a last hour boost pushed them back into the green, thereby closing the last trading day of the year on a positive note.
Low volume and profit taking by traders had equities in the red, until a slow and steady ascent emerged, which was followed by sharp push higher into the close. Positive news on the trade front assured that the early pullback remained moderate. In the end, it ended up being a springboard for higher prices, as we’ve seen many times in the past.
White House advisor Navarro said the China deal was “in the bank,” while Trump confirmed it via a tweet:
I will be signing our very large and comprehensive Phase One Trade Deal with China on January 15. The ceremony will take place at the White House. High level representatives of China will be present. At a later date, I will be going to Beijing where talks will begin on Phase Two!
With 2019 in the bag, let’s remember that not the underlying fundamentals nor a great economy were the driver of stocks and bonds this year. On the contrary, it was Central Bank intervention providing an unprecedented surge in liquidity, a huge portion of which was dumped into the markets. This chart, thanks to Bloomberg, makes that abundantly clear.
Given current Central Bank policy, there is a good chance that this theme will continue in 2020, unless a black swan event upsets the bullish market trend, in which case our exit strategy will be of immense value.
Happy New Year!
Ulli…
2. ETFs in the Spotlight
In case you missed the announcement and description of this section, you can read it here again.
It features 10 broadly diversified and sector ETFs from my HighVolume list as posted every Saturday. Furthermore, they are screened for the lowest MaxDD% number meaning they have been showing better resistance to temporary sell offs than all others over the past year.
The below table simply demonstrates the magnitude with which some of the ETFs are fluctuating regarding their positions above or below their respective individual trend lines (%+/-M/A). A break below, represented by a negative number, shows weakness, while a break above, represented by a positive percentage, shows strength.
For hundreds of ETF choices, be sure to reference Thursday’s StatSheet.
For this current domestic “Buy” cycle, here’s how some our candidates have fared:
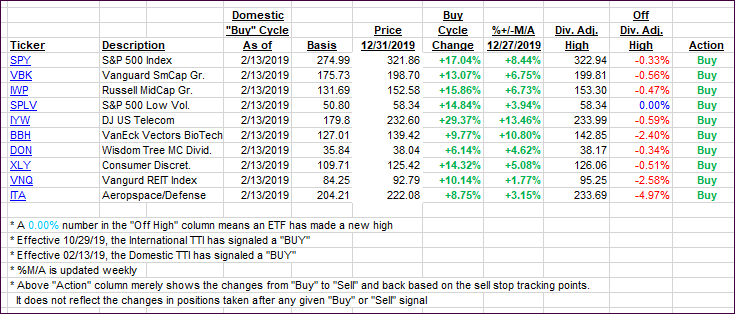
Click image to enlarge
Again, the %+/-M/A column above shows the position of the various ETFs in relation to their respective long-term trend lines, while the trailing sell stops are being tracked in the “Off High” column. The “Action” column will signal a “Sell” once the -8% point has been taken out in the “Off High” column. For more volatile sector ETFs, the trigger point is -10%.
3. Trend Tracking Indexes (TTIs)
Our Trend Tracking Indexes (TTIs) inched higher, as a last hour pump pushed the major indexes to a green close.
Here’s how we closed 12/31/2019:
Domestic TTI: +7.71% above its M/A (prior close +7.31%)—Buy signal effective 02/13/2019
International TTI: +6.15% above its M/A (prior close +6.02%)—Buy signal effective 10/29/2019
Disclosure: I am obliged to inform you that I, as well as my advisory clients, own some of the ETFs listed in the above table. Furthermore, they do not represent a specific investment recommendation for you, they merely show which ETFs from the universe I track are falling within the specified guidelines.
Contact Ulli