
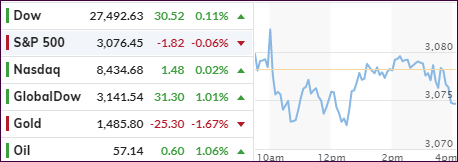
- Moving the markets
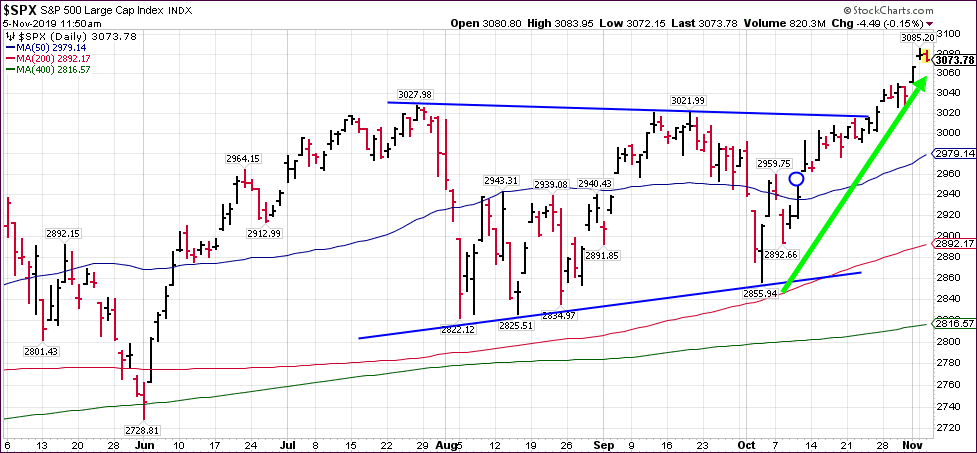
Ever since we had 2 down days at the beginning of October, equities have been on a relentless march higher (green arrow in chart) with virtually no interruption. Despite the Fed’s efforts to lower interest rates, this rally happened in the face of rising bond yields, an event that usually takes the starch out of upward equity moves.
But we seem to be living in a financial system where historical norms no longer apply. The fallout from higher rates has been a recent underperformance of not just bond ETFs but also the low volatility ETFs like SPLV, which had been one of the top performers for the first 9 months of this year. In my advisor practice, I have now reduced our exposure to SPLV.
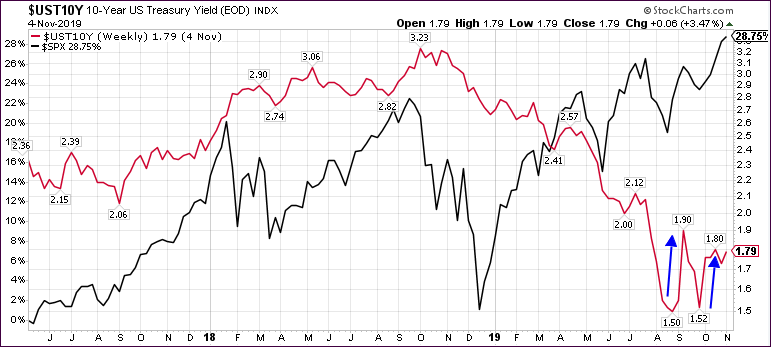
It simply lost its luster, as a result of 10-year bond yields starting to hiccup early in September, after having been on a downward trajectory all year. Today, the yield rocketed another 8 basis points higher to close at around 1.86%, which is within striking distance of taking out the September high of 1.90%.
If this continues, there will be a point, however, when equities will be affected by rising yields, but that moment in time is still the big unknown. On the other hand, as I posted yesterday, thanks to the largesse of the Central Banks injection of liquidity (the Fed added $250 billion just in the last 8 weeks), we have now two opposing forces, that simply can be looked at as an ongoing tug-of-war between bulls and bears with the outcome to be determined.
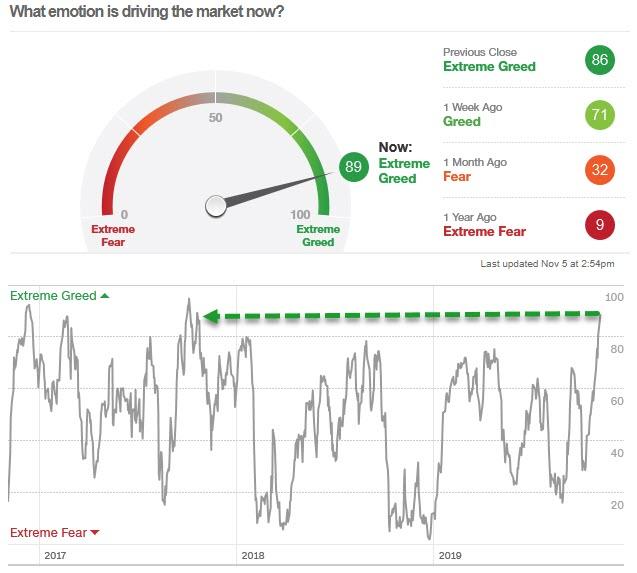
While today was a session during which the major indexes clustered around their respective unchanged lines, it looks to me, for the time being, that the power of liquidity may win and propel the markets higher, despite extreme greed having set in already.
2. ETFs in the Spotlight
In case you missed the announcement and description of this section, you can read it here again.
It features 10 broadly diversified and sector ETFs from my HighVolume list as posted every Saturday. Furthermore, they are screened for the lowest MaxDD% number meaning they have been showing better resistance to temporary sell offs than all others over the past year.
The below table simply demonstrates the magnitude with which some of the ETFs are fluctuating regarding their positions above or below their respective individual trend lines (%+/-M/A). A break below, represented by a negative number, shows weakness, while a break above, represented by a positive percentage, shows strength.
For hundreds of ETF choices, be sure to reference Thursday’s StatSheet.
For this current domestic “Buy” cycle, here’s how some our candidates have fared:
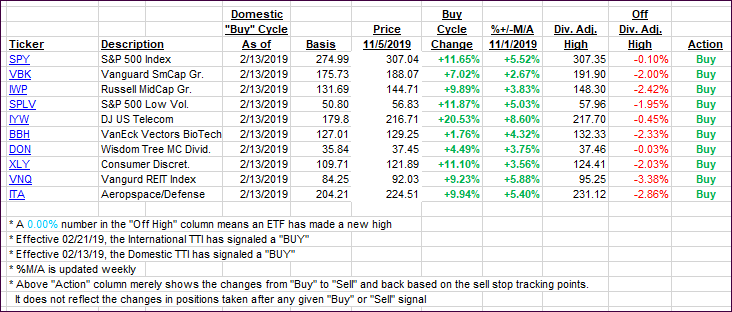
Again, the %+/-M/A column above shows the position of the various ETFs in relation to their respective long-term trend lines, while the trailing sell stops are being tracked in the “Off High” column. The “Action” column will signal a “Sell” once the -8% point has been taken out in the “Off High” column. For more volatile sector ETFs, the trigger point is -10%.
3. Trend Tracking Indexes (TTIs)
Our Trend Tracking Indexes (TTIs) held steady with only the International one moving a tad higher.
Here’s how we closed 11/05/2019:
Domestic TTI: +5.58% above its M/A (prior close +5.58%)—Buy signal effective 02/13/2019
International TTI: +4.00% above its M/A (prior close +3.76%)—Buy signal effective 10/29/2019
Disclosure: I am obliged to inform you that I, as well as my advisory clients, own some of the ETFs listed in the above table. Furthermore, they do not represent a specific investment recommendation for you, they merely show which ETFs from the universe I track are falling within the specified guidelines.
Contact Ulli