
- Moving the markets
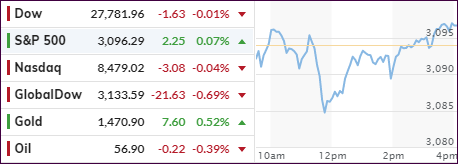
The bouncing below the unchanged lines went on throughout the session with the major indexes having a hard time seeing green, with only the S&P 500 and Dow briefly peeking into positive territory.
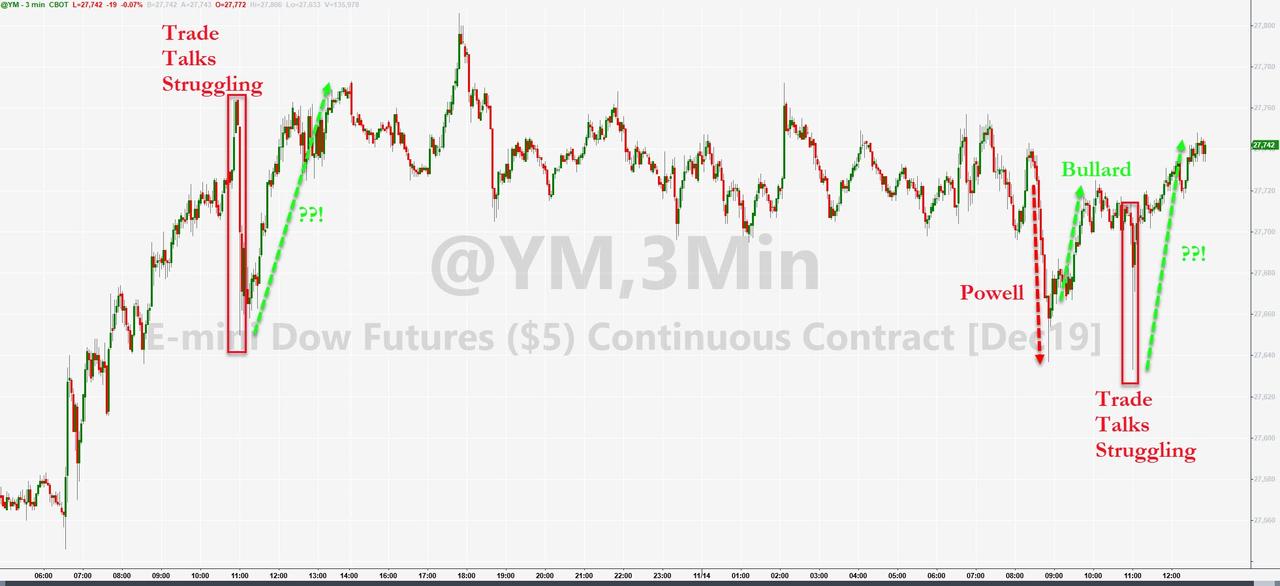
The cause for this lack of upward momentum turned out to be usual culprit, namely the latest trade reports casting a big shadow on some of the alleged process. For one, the White House “conceded that the original target date may slip,” but they denied reports of a setback.
Other bon mots included things like “China was absolutely delaying the truce with its approach,” and “there is a lot of jockeying going on—it’s a standoff, in part,” all of which did nothing to calm the markets. However, the positive in all that was that the indexes remained stable and closed within a fraction of their respective unchanged lines.
Even the mid-day tumble was stopped by an influx of dip buyers making this pullback an event now long forgotten and only visible in the rear-view mirror. So, the trade movie continues with all of its idiosyncrasies, as the market-implied odds of a trade deal are worsening from day to day.
On a side note, I had to crack up today when I heard the latest interpretation of using politically correct language, an area that seems to have taken on a life of its own. You’ll be delighted to hear that a new word is spreading in the investment community.
We all, especially the buy-and-hold crowd, certainly remember the crash of 2008, which decimated many portfolios, and I believe the next one will even be more destructive, whenever it arrives. To lessen the pain, some joker suggested we call such an event no longer a “crash” but rather “a sudden value reassessment.”
Well, I don’t know about you, but I would feel far more comfortable losing 50% of my portfolio due to “a sudden value reassessment” than due to a “crash,” wouldn’t you agree?
2. ETFs in the Spotlight
In case you missed the announcement and description of this section, you can read it here again.
It features 10 broadly diversified and sector ETFs from my HighVolume list as posted every Saturday. Furthermore, they are screened for the lowest MaxDD% number meaning they have been showing better resistance to temporary sell offs than all others over the past year.
The below table simply demonstrates the magnitude with which some of the ETFs are fluctuating regarding their positions above or below their respective individual trend lines (%+/-M/A). A break below, represented by a negative number, shows weakness, while a break above, represented by a positive percentage, shows strength.
For hundreds of ETF choices, be sure to reference Thursday’s StatSheet.
For this current domestic “Buy” cycle, here’s how some our candidates have fared:
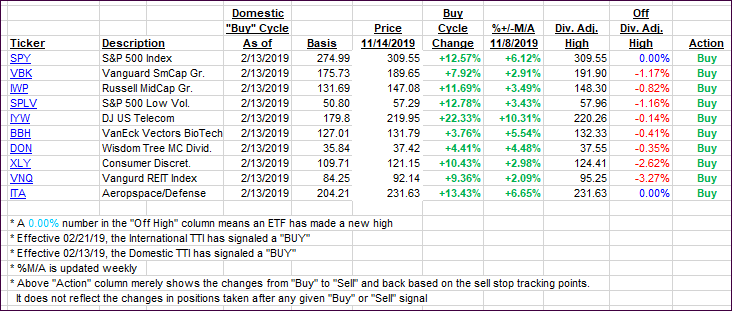
Again, the %+/-M/A column above shows the position of the various ETFs in relation to their respective long-term trend lines, while the trailing sell stops are being tracked in the “Off High” column. The “Action” column will signal a “Sell” once the -8% point has been taken out in the “Off High” column. For more volatile sector ETFs, the trigger point is -10%.
3. Trend Tracking Indexes (TTIs)
Our Trend Tracking Indexes (TTIs) were mixed with the Domestic one gaining and the International one slipping.
Here’s how we closed 11/14/2019:
Domestic TTI: +5.58% above its M/A (prior close +5.35%)—Buy signal effective 02/13/2019
International TTI: +3.53% above its M/A (prior close +3.80%)—Buy signal effective 10/29/2019
Disclosure: I am obliged to inform you that I, as well as my advisory clients, own some of the ETFs listed in the above table. Furthermore, they do not represent a specific investment recommendation for you, they merely show which ETFs from the universe I track are falling within the specified guidelines.
Contact Ulli