
- Moving the markets
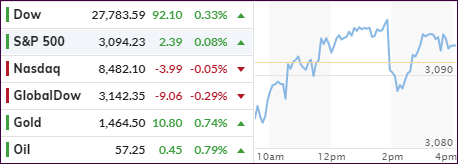
It was another trading day during which uncertainty ruled. The major indexes survived an early sell-off and bounced back only to be slammed back down below their respective unchanged lines.
Give credit to the mid-day slam to a US-China trade problem, caused by reports that that a snag was hit over farm purchases. Then China barked by “resisting US requests for tech-transfer curbs and any enforcement mechanism.” Needless to say, the markets were not amused and down we went, while at the same time the latest short squeeze appeared to have run out of ammunition.
In the end, however, the indexes managed a comeback into the green with the weakling being the Nasdaq, which bumped against its unchanged line but failed to conquer it.
However, I consider one development today an important one, namely that the recent bond sell-off, during which the widely followed 10-year yield spiked dramatically, thereby taking the starch out of low volatility ETFs like SPLV, appeared to have reversed. After pushing towards the 2% level, the yield pulled back and closed at 1.88%, which allowed SPLV finally to have a good day by gaining +0.78% vs. the meager +0.05% the S&P 500 (SPY) generated.
While the 5-week old rally continues to roll on, today’s gains were small, but they were gains, nonetheless. I keep harping on the importance of liquidity as being “the driver” for further advances. Well, the Fed has pumped some $280 billion into the system over the past 7 weeks, which all but guarantees the momentum necessary to support the bullish theme.
Never mind that the October budget deficit surged 34% to $134 billion, which was its worst in five years. There is nothing but red ink in our future, but who cares about such minor details, if it stokes the liquidity engine.
2. ETFs in the Spotlight
In case you missed the announcement and description of this section, you can read it here again.
It features 10 broadly diversified and sector ETFs from my HighVolume list as posted every Saturday. Furthermore, they are screened for the lowest MaxDD% number meaning they have been showing better resistance to temporary sell offs than all others over the past year.
The below table simply demonstrates the magnitude with which some of the ETFs are fluctuating regarding their positions above or below their respective individual trend lines (%+/-M/A). A break below, represented by a negative number, shows weakness, while a break above, represented by a positive percentage, shows strength.
For hundreds of ETF choices, be sure to reference Thursday’s StatSheet.
For this current domestic “Buy” cycle, here’s how some our candidates have fared:
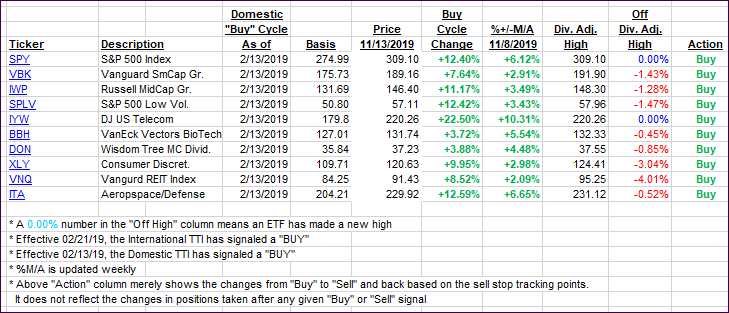
Again, the %+/-M/A column above shows the position of the various ETFs in relation to their respective long-term trend lines, while the trailing sell stops are being tracked in the “Off High” column. The “Action” column will signal a “Sell” once the -8% point has been taken out in the “Off High” column. For more volatile sector ETFs, the trigger point is -10%.
3. Trend Tracking Indexes (TTIs)
Our Trend Tracking Indexes (TTIs) pulled back with today’s advance being narrow rather than broad.
Here’s how we closed 11/13/2019:
Domestic TTI: +5.35% above its M/A (prior close +5.43%)—Buy signal effective 02/13/2019
International TTI: +3.80% above its M/A (prior close +4.24%)—Buy signal effective 10/29/2019
Disclosure: I am obliged to inform you that I, as well as my advisory clients, own some of the ETFs listed in the above table. Furthermore, they do not represent a specific investment recommendation for you, they merely show which ETFs from the universe I track are falling within the specified guidelines.
Contact Ulli