
- Moving the markets
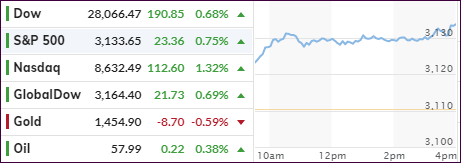
The markets took another jump higher powered by some mega mergers and the good old stand-by, namely the trade talks. All last week’s concerns vanished over the weekend on China’s decision to issue guidelines and raise penalties for intellectual property theft.
This was immediately interpreted as a step in the right direction boosting the chances of a trade deal between the U.S. and China. Never mind that Reuters reported that a “phase 2” of the deal may not happen any time soon, if ever.
This was offset by a tweet by the Chinese mouthpiece, the Global Times, which said that the warring parties might be “very close” to reaching a “phase 1 deal,” according to the infamous and unknown experts close to the Chinese government.
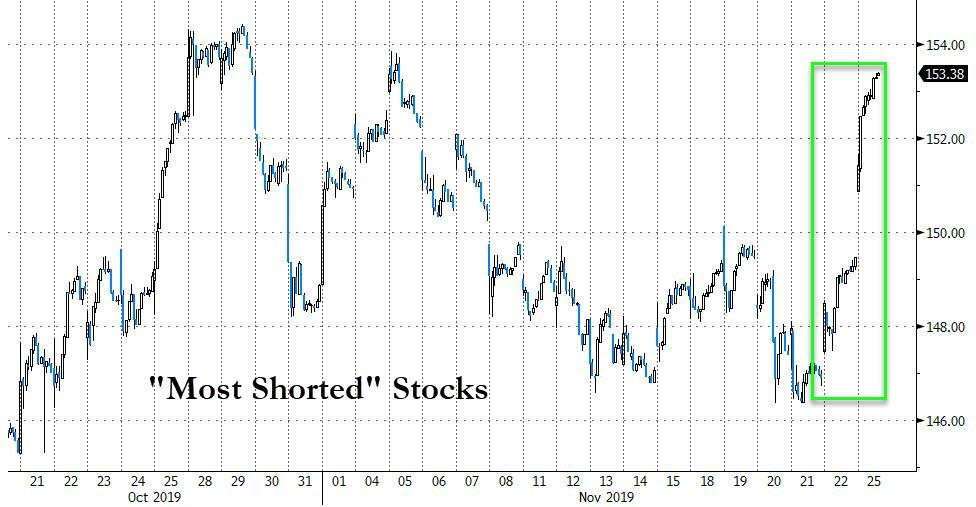
This got the rally started, and the major indexes never looked back with all three of them setting new intraday highs and/or surpassing previous records. As we’ve seen many time before, giving a huge assist was the biggest short squeeze we’ve seen since October which sent SmallCaps sharply higher.
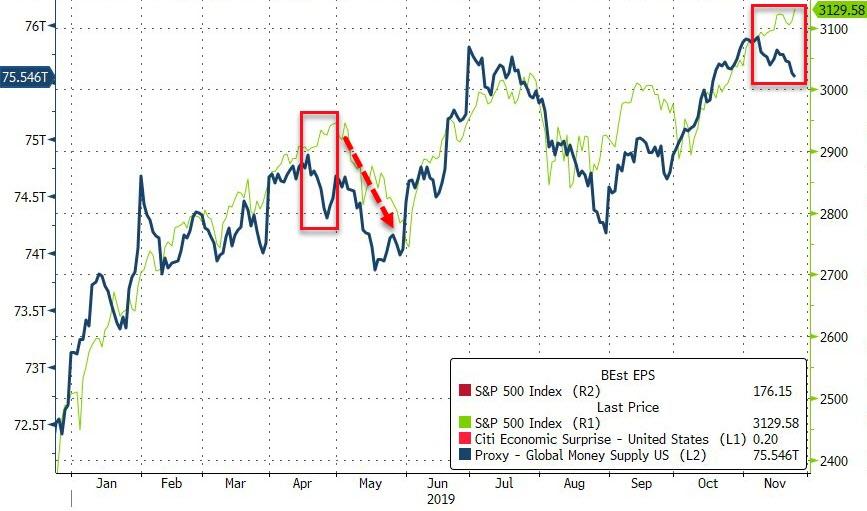
Surprisingly, and may be due to continued issues in the overnight lending market (repos), global liquidity started to reverse, just like it did in April. That brings up the question as to whether equities will follow. After all, as I have posted numerous times, the big driver of stocks is liquidity. If that continues in the direction this chart from Bloomberg indicates, we could see equity weakness ahead.
2. ETFs in the Spotlight
In case you missed the announcement and description of this section, you can read it here again.
It features 10 broadly diversified and sector ETFs from my HighVolume list as posted every Saturday. Furthermore, they are screened for the lowest MaxDD% number meaning they have been showing better resistance to temporary sell offs than all others over the past year.
The below table simply demonstrates the magnitude with which some of the ETFs are fluctuating regarding their positions above or below their respective individual trend lines (%+/-M/A). A break below, represented by a negative number, shows weakness, while a break above, represented by a positive percentage, shows strength.
For hundreds of ETF choices, be sure to reference Thursday’s StatSheet.
For this current domestic “Buy” cycle, here’s how some our candidates have fared:
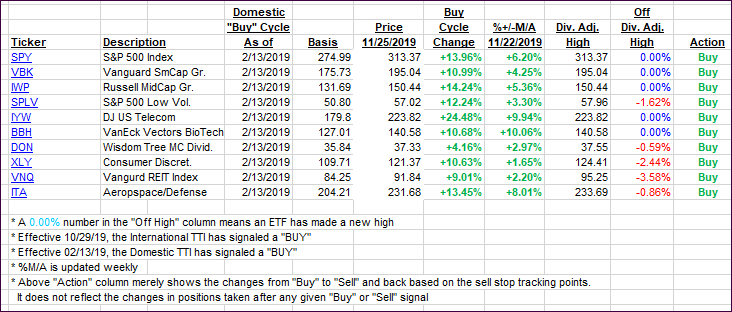
Again, the %+/-M/A column above shows the position of the various ETFs in relation to their respective long-term trend lines, while the trailing sell stops are being tracked in the “Off High” column. The “Action” column will signal a “Sell” once the -8% point has been taken out in the “Off High” column. For more volatile sector ETFs, the trigger point is -10%.
3. Trend Tracking Indexes (TTIs)
Our Trend Tracking Indexes (TTIs) jumped as the bulls were clearly in charge.
Here’s how we closed 11/25/2019:
Domestic TTI: +6.29% above its M/A (prior close +5.34%)—Buy signal effective 02/13/2019
International TTI: +4.27% above its M/A (prior close +3.52%)—Buy signal effective 10/29/2019
Disclosure: I am obliged to inform you that I, as well as my advisory clients, own some of the ETFs listed in the above table. Furthermore, they do not represent a specific investment recommendation for you, they merely show which ETFs from the universe I track are falling within the specified guidelines.
Contact Ulli