
- Moving the markets
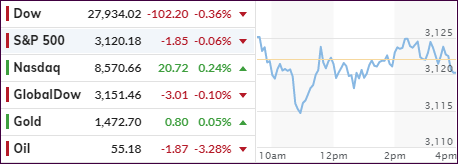
Today we experienced a market condition, which we have not seen in a while, namely not just an intra-day sell off, but also a red close of more than the occasional shocking -0.01%, at least for the Dow. Of course, I am being facetious here, but the usual end of the day ramp saved the S&P 500 and Nasdaq.
However, given the relentless march higher, today’s partial retreat was more than overdue. A slightly positive opening gave way to a gentle slide into the red zone, but the bullish theme remained strong enough to assist in the recovery.
Not helping matters were disappointing earnings results and the good old standby excuse that a US-China deal has become questionable.
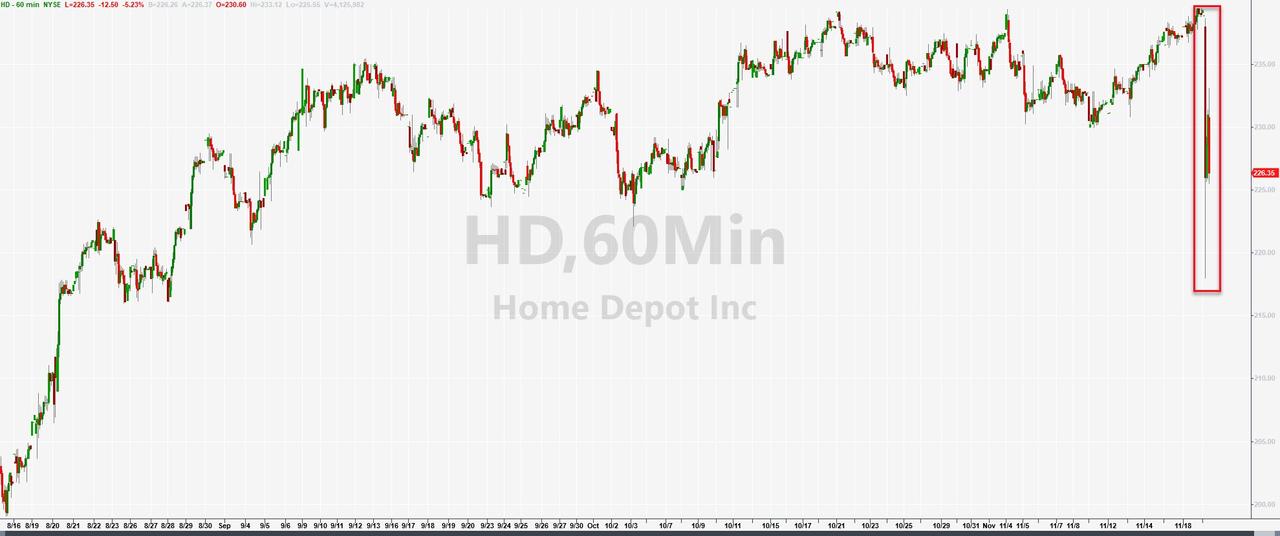
Home Depot’s shares took a hit with the company not just posting a miss in Q3 sales, but more importantly, they slashed their full-year sales guidance as well. Ouch! However, offsetting that poor report was a rise in US home building and permits for future construction.
Clearly, the economy, despite being hyped up, is mixed bag at best. Even the Fed’s John Williams seems to agree as he posted things like “the economy is clearly facing several challenges, primarily from overseas, but the three rate cuts since July should help sustain growth,” on which he elaborated further with the US “facing headwinds from slower global growth.”
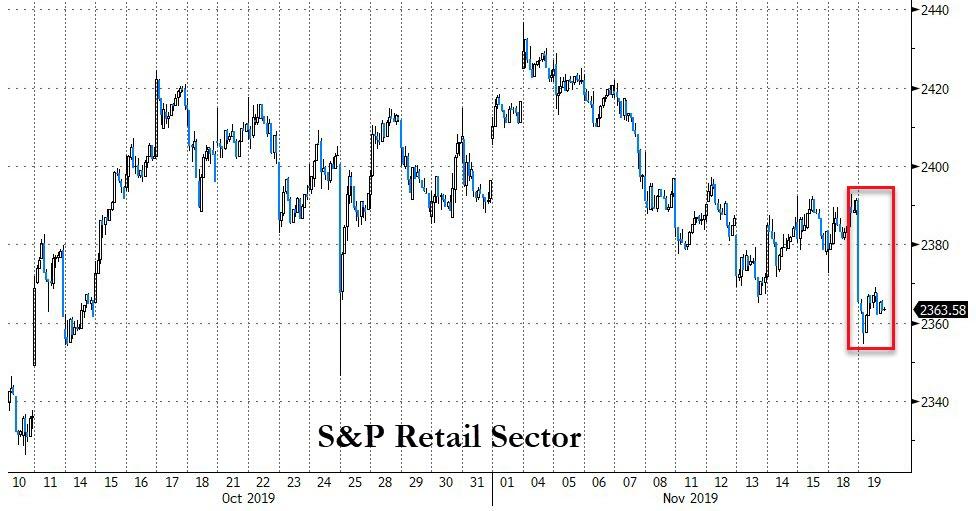
In the end, nothing much was gained or lost, except the Nasdaq remained on the plus side all day and added +0.24%. At least the tech arena showed signs of life in the face of a sinking retail sector, where the stocks of Home Depot and Kohls were sent reeling.
With no obvious driver to help the markets today, I imagine that we will see a new rollout of “the trade deal is close” headlines latest by tomorrow, in order to pump stocks further into record territory.
2. ETFs in the Spotlight
In case you missed the announcement and description of this section, you can read it here again.
It features 10 broadly diversified and sector ETFs from my HighVolume list as posted every Saturday. Furthermore, they are screened for the lowest MaxDD% number meaning they have been showing better resistance to temporary sell offs than all others over the past year.
The below table simply demonstrates the magnitude with which some of the ETFs are fluctuating regarding their positions above or below their respective individual trend lines (%+/-M/A). A break below, represented by a negative number, shows weakness, while a break above, represented by a positive percentage, shows strength.
For hundreds of ETF choices, be sure to reference Thursday’s StatSheet.
For this current domestic “Buy” cycle, here’s how some our candidates have fared:
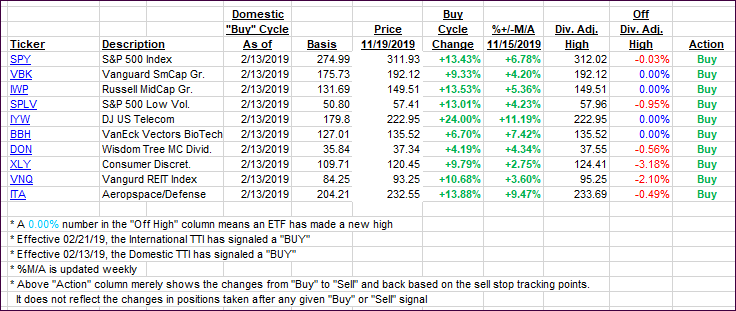
Again, the %+/-M/A column above shows the position of the various ETFs in relation to their respective long-term trend lines, while the trailing sell stops are being tracked in the “Off High” column. The “Action” column will signal a “Sell” once the -8% point has been taken out in the “Off High” column. For more volatile sector ETFs, the trigger point is -10%.
3. Trend Tracking Indexes (TTIs)
Our Trend Tracking Indexes (TTIs) slipped as today’s trend was one of recovery due to an early sell-off.
Here’s how we closed 11/19/2019:
Domestic TTI: +5.88% above its M/A (prior close +5.97%)—Buy signal effective 02/13/2019
International TTI: +3.96% above its M/A (prior close +4.01%)—Buy signal effective 10/29/2019
Disclosure: I am obliged to inform you that I, as well as my advisory clients, own some of the ETFs listed in the above table. Furthermore, they do not represent a specific investment recommendation for you, they merely show which ETFs from the universe I track are falling within the specified guidelines.
Contact Ulli