
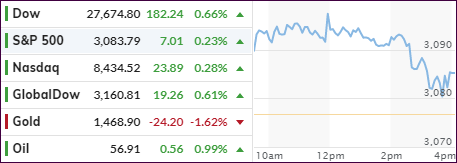
- Moving the markets
With the earnings season fading away, the US-China trade disagreement moved to center stage again, with positive statements stoking the markets and continuing the relentless push higher.
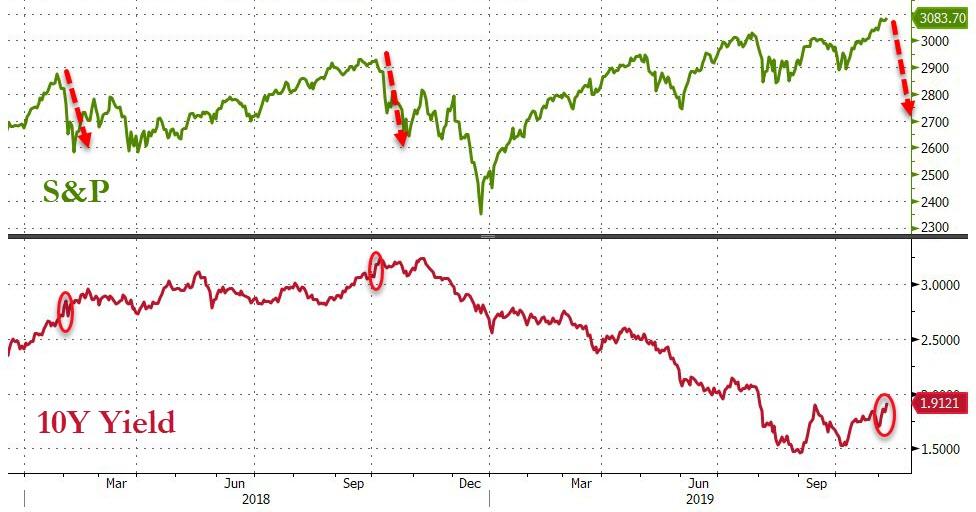
This happened again in the face of sharply rising bond yields with the 10-year jumping an amazing 10.57 basis points to end the day at 1.92%. This was an aggressive rise in yields, an event that in the past has always been a bad omen for stocks, so will it be different this time?
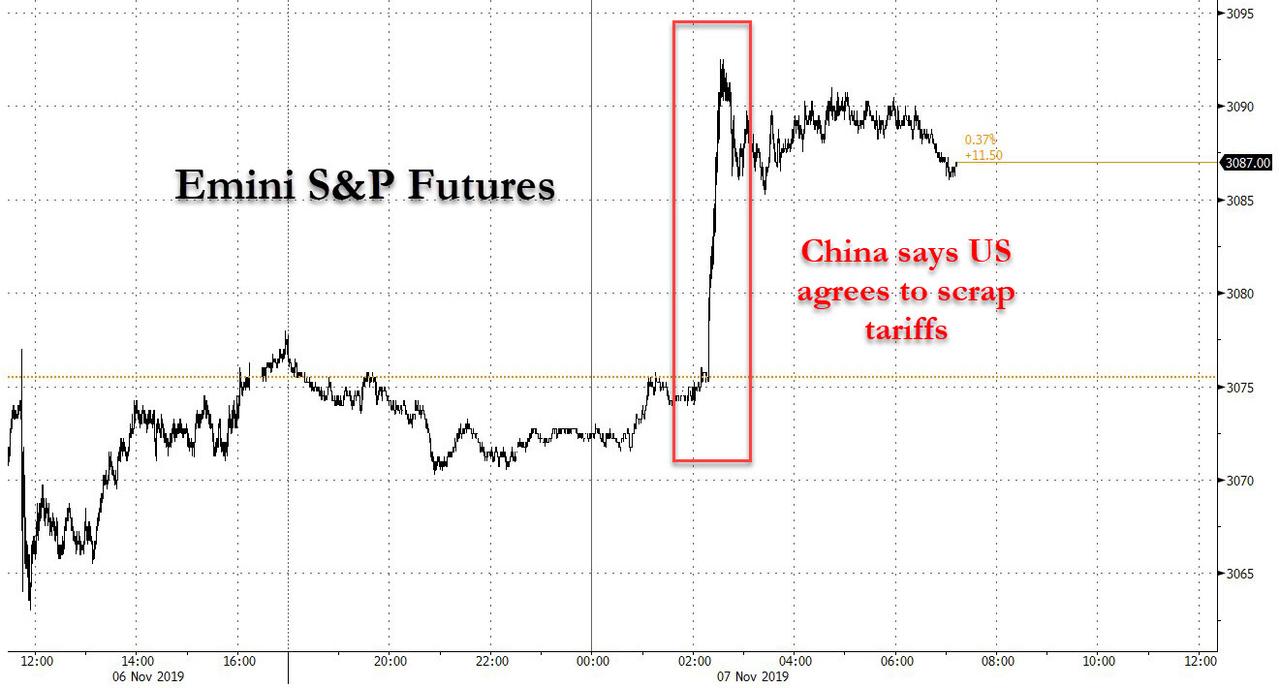
Today’s ramp started early on when the futures market set the bullish tone after China said that the US had agree to roll back tariffs. The alleged agreement was that China and the US would roll back tariffs on each other’s goods in phases while working towards a trade deal, the optimism of which has now contributed to the rally over the past 5 days.
For sure, the market’s mood kept getting better with some analysts arguing that any resolution would halt or at least slow down the current path towards the much-feared global recession. At the same time, some of the slowing countries like Europe, Japan and even China may have bottomed in terms of their economies weakening; at least so goes the hopeful thinking.
Then came a cool wind of reality when Reuters reported that according to “sources” the White House plan to roll back China tariffs “faces fierce internal opposition,” which yanked the markets off their lofty intra-day highs but still enabled the major indexes to score another winning session.
And so, the saga goes on…
2. ETFs in the Spotlight
In case you missed the announcement and description of this section, you can read it here again.
It features 10 broadly diversified and sector ETFs from my HighVolume list as posted every Saturday. Furthermore, they are screened for the lowest MaxDD% number meaning they have been showing better resistance to temporary sell offs than all others over the past year.
The below table simply demonstrates the magnitude with which some of the ETFs are fluctuating regarding their positions above or below their respective individual trend lines (%+/-M/A). A break below, represented by a negative number, shows weakness, while a break above, represented by a positive percentage, shows strength.
For hundreds of ETF choices, be sure to reference Thursday’s StatSheet.
For this current domestic “Buy” cycle, here’s how some our candidates have fared:
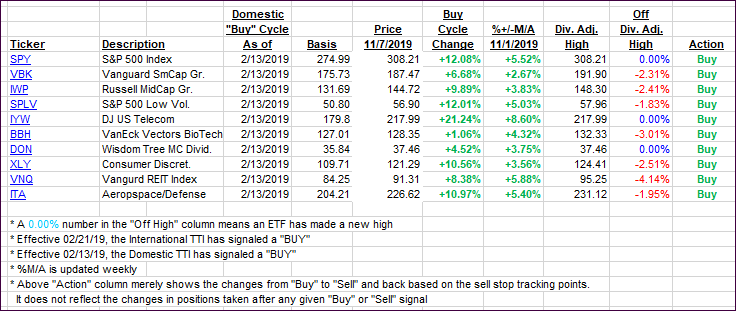
Again, the %+/-M/A column above shows the position of the various ETFs in relation to their respective long-term trend lines, while the trailing sell stops are being tracked in the “Off High” column. The “Action” column will signal a “Sell” once the -8% point has been taken out in the “Off High” column. For more volatile sector ETFs, the trigger point is -10%.
3. Trend Tracking Indexes (TTIs)
Our Trend Tracking Indexes (TTIs) inched higher as the trade deal hope driven rally continued.
Here’s how we closed 11/07/2019:
Domestic TTI: +5.72% above its M/A (prior close +5.58%)—Buy signal effective 02/13/2019
International TTI: +4.64% above its M/A (prior close +4.00%)—Buy signal effective 10/29/2019
Disclosure: I am obliged to inform you that I, as well as my advisory clients, own some of the ETFs listed in the above table. Furthermore, they do not represent a specific investment recommendation for you, they merely show which ETFs from the universe I track are falling within the specified guidelines.
Contact Ulli