
ETF Tracker StatSheet
You can view the latest version here.
SEARCHING FOR CLARITY
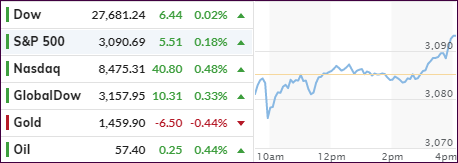
- Moving the markets
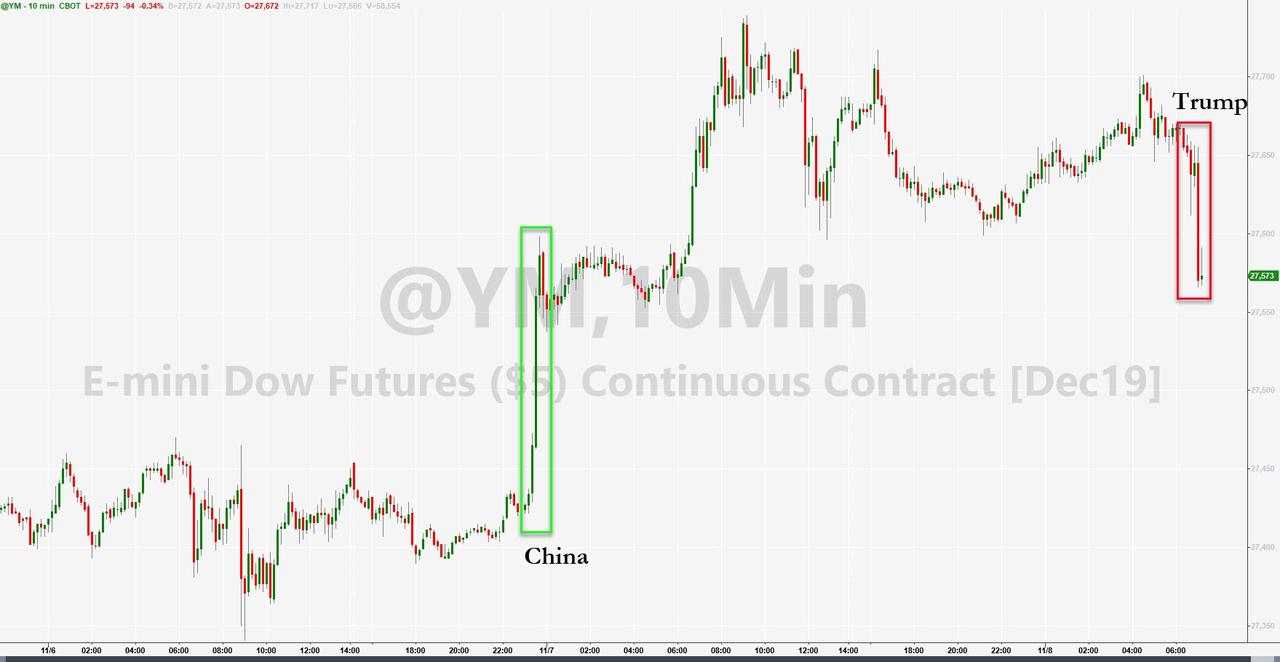
The futures market took the early lead by heading south after Trump’s confirmation that he has not agreed to roll back tariffs with China, which was opposite of what economic advisor Larry Kudlow had stated.
The early dump was quickly reversed, however, as the major indexes scrambled back towards their respective unchanged lines. They hung around for the remainder of the session with only a small gain to show for the day but closing higher for the week.
As I posted yesterday, the driver for the past 5 days or so has been the continued pumping of alleged positive trade news, even if they were “revised” later, as was the case today.
It is a sure sign of bullishness in the marketplace when doubts about previous trade agreements don’t affect effect equities negatively. In other words, fresh clouds over trade talks are not eliminating the cheery outlook traders seem to have.
Even the computer algos, designed to react instantly to questionable announcements, seem not to be impacted, maybe due to the planned “phase one” pact still being on schedule.
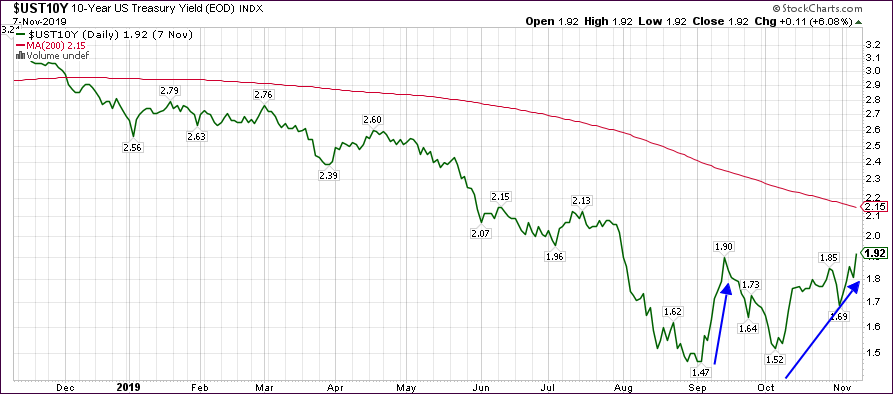
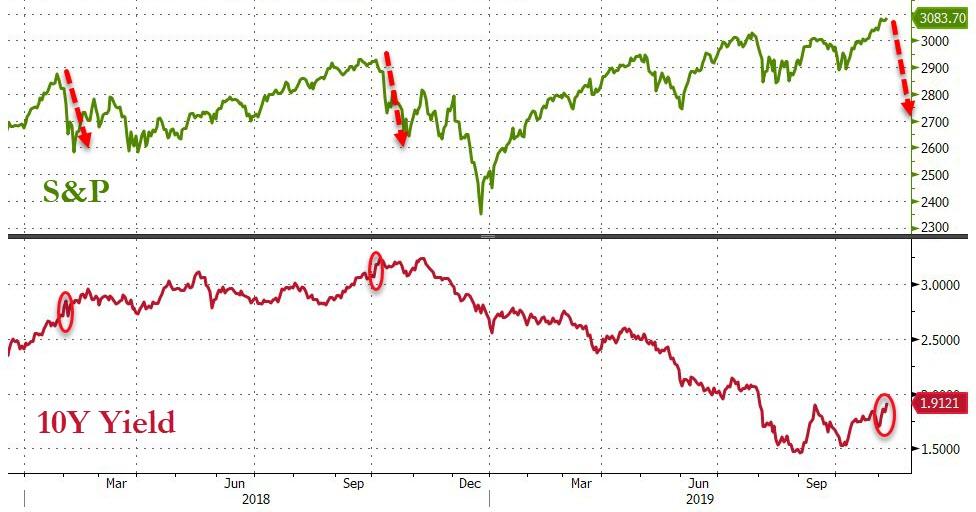
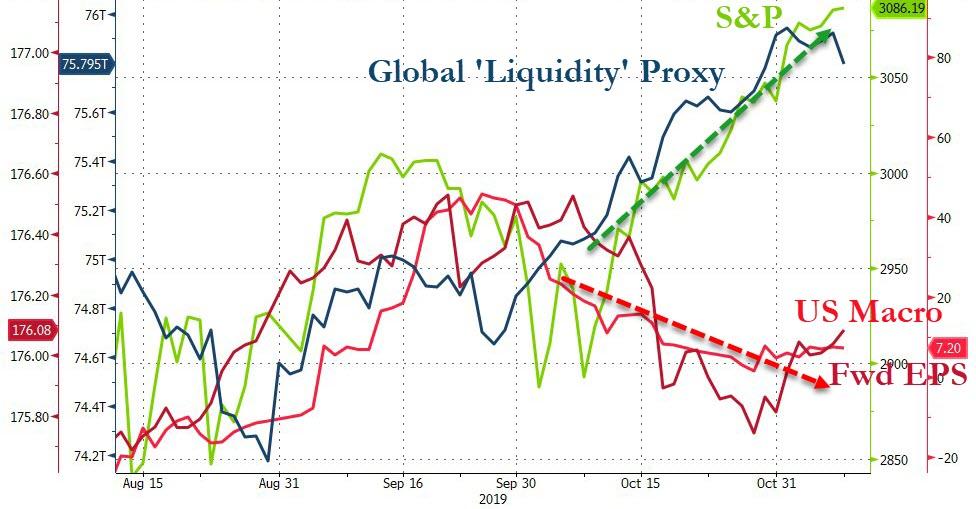
While all seems rosy in equity land, the bond market echoes a different view. Yields on the 10-year catapulted recently and reached a high last seen in August. If rising yields morph into a bond market meltdown, the current stock rally could fade in a hurry.
However, for right now the trend is up, and we’ll enjoy the ride, because we know that “liquidity” is our friend and continues to be the primary driver for equities.
2. ETFs in the Spotlight
In case you missed the announcement and description of this section, you can read it here again.
It features 10 broadly diversified and sector ETFs from my HighVolume list as posted every Saturday. Furthermore, they are screened for the lowest MaxDD% number meaning they have been showing better resistance to temporary sell offs than all others over the past year.
The below table simply demonstrates the magnitude with which some of the ETFs are fluctuating regarding their positions above or below their respective individual trend lines (%+/-M/A). A break below, represented by a negative number, shows weakness, while a break above, represented by a positive percentage, shows strength.
For hundreds of ETF choices, be sure to reference Thursday’s StatSheet.
For this current domestic “Buy” cycle, here’s how some our candidates have fared:
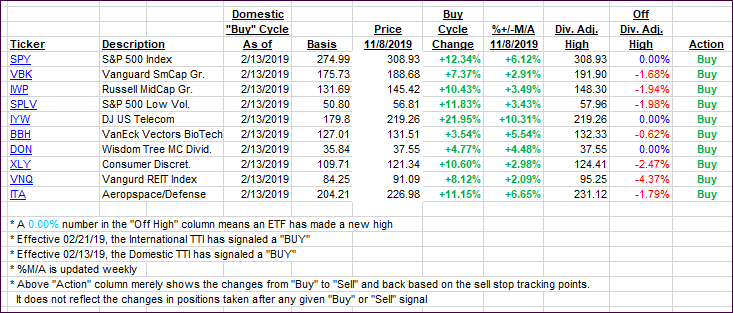
Again, the %+/-M/A column above shows the position of the various ETFs in relation to their respective long-term trend lines, while the trailing sell stops are being tracked in the “Off High” column. The “Action” column will signal a “Sell” once the -8% point has been taken out in the “Off High” column. For more volatile sector ETFs, the trigger point is -10%.
3. Trend Tracking Indexes (TTIs)
Our Trend Tracking Indexes (TTIs) pulled back a tad as market action was subdued.
Here’s how we closed 11/08/2019:
Domestic TTI: +5.65% above its M/A (prior close +5.72%)—Buy signal effective 02/13/2019
International TTI: +4.33% above its M/A (prior close +4.00%)—Buy signal effective 10/29/2019
Disclosure: I am obliged to inform you that I, as well as my advisory clients, own some of the ETFs listed in the above table. Furthermore, they do not represent a specific investment recommendation for you, they merely show which ETFs from the universe I track are falling within the specified guidelines.
———————————————————-
WOULD YOU LIKE TO HAVE YOUR INVESTMENTS PROFESSIONALLY MANAGED?
Do you have the time to follow our investment plans yourself? If you are a busy professional who would like to have his portfolio managed using our methodology, please contact me directly or get more details here.
———————————————————
Back issues of the ETF Tracker are available on the web.
Contact Ulli