
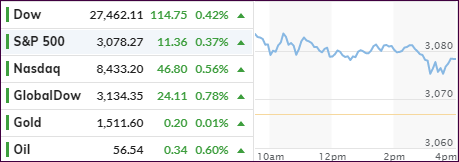
- Moving the markets
There wasn’t really a driving force behind today’s continued rally, as the futures markets started the bullish theme via the same old playbook.
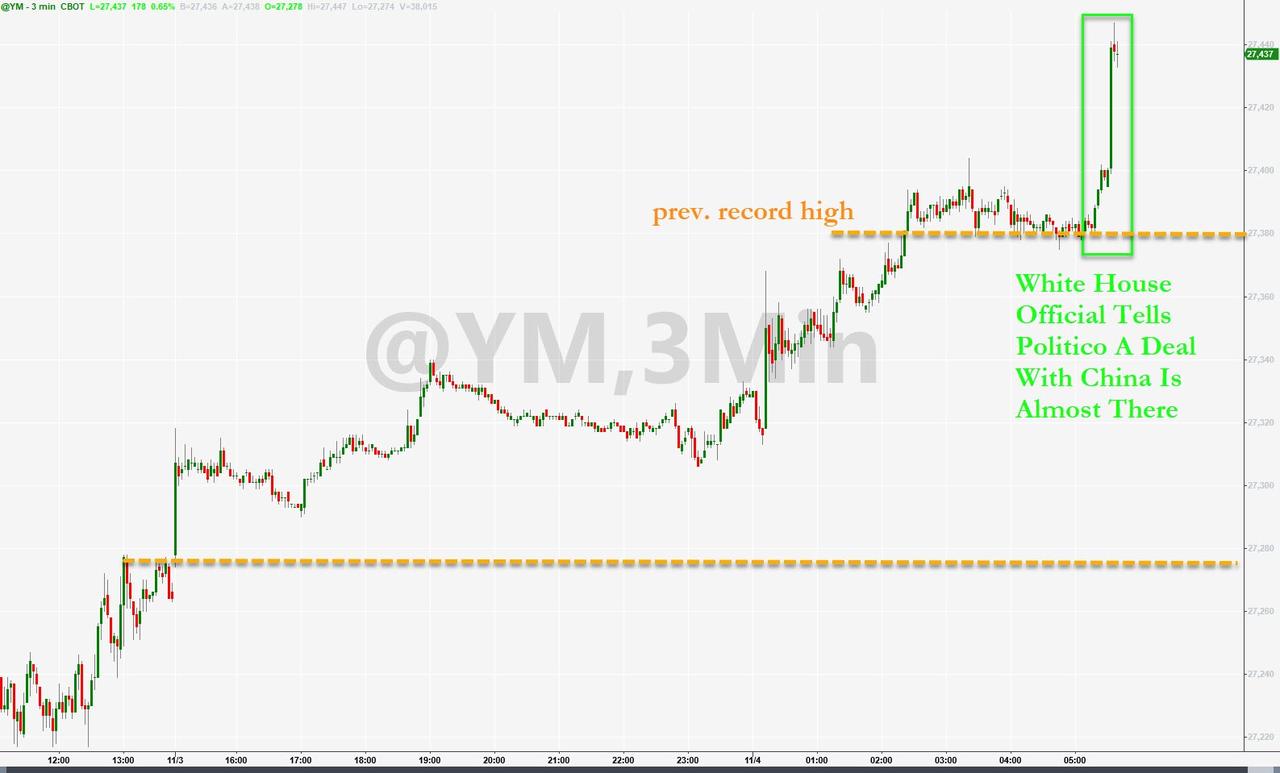
The trade carrot was dangled again and came into play on a news headline that “a White House officials tells Politico a deal with China is almost there…” That was enough for the headline scanning computer algos to pump the markets higher leaving me pondering what the effect might be if there “is” or “is not” a deal? It also did not matter that bond yields surged thereby giving SPY another chance to close the performance gap with SPLV.
Then came Commerce Secretary Wilbur Ross’s announcement that, while some licenses for companies to do business with China’s Huawei Technologies, will be coming “very shortly,” he cautioned that a preliminary deal might not be ready to be signed this month.
Fundamentals certainly did not contribute to the upswing with Factory orders sagging and experiencing their biggest contraction since the middle of 2016. The YoY contraction came in at -3.5%, while Durable Goods orders added more negativity in September by dropping -1.2% MoM and -4.0% YoY. Not exactly an awe-inspiring contribution to the “best economy ever.”
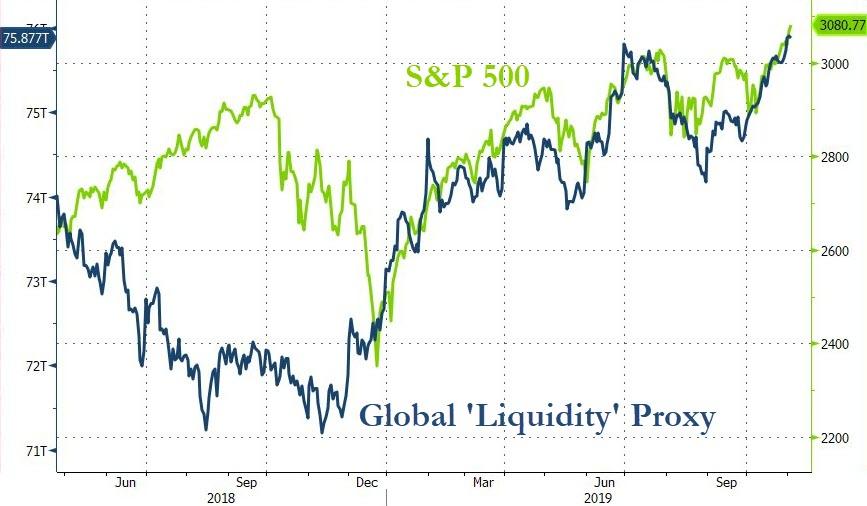
Of course, we all know that the state of the economy has nothing to do with the level of stock markets around the world; it’s liquidity that is the secret sauce behind the massive drive higher.
This chart makes this abundantly clear and, if you look at the left side, you’ll note that during the past year, a $4 trillion surge in global money supply (from $71 trillion to $75.8 trillion) was the primary reason for the bullish optimism, thereby totally discounting any underlying economic issues.
With the Fed having announced a $60 billion a month purchase program for Treasuries, there is a good chance that this added liquidity will find its way into the stock market, at least for the time being.
2. ETFs in the Spotlight
In case you missed the announcement and description of this section, you can read it here again.
It features 10 broadly diversified and sector ETFs from my HighVolume list as posted every Saturday. Furthermore, they are screened for the lowest MaxDD% number meaning they have been showing better resistance to temporary sell offs than all others over the past year.
The below table simply demonstrates the magnitude with which some of the ETFs are fluctuating regarding their positions above or below their respective individual trend lines (%+/-M/A). A break below, represented by a negative number, shows weakness, while a break above, represented by a positive percentage, shows strength.
For hundreds of ETF choices, be sure to reference Thursday’s StatSheet.
For this current domestic “Buy” cycle, here’s how some our candidates have fared:
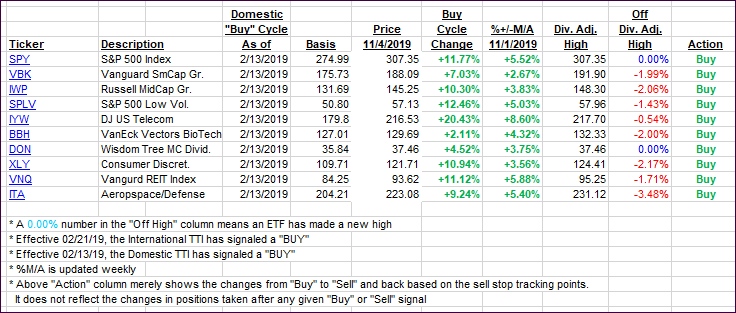
Again, the %+/-M/A column above shows the position of the various ETFs in relation to their respective long-term trend lines, while the trailing sell stops are being tracked in the “Off High” column. The “Action” column will signal a “Sell” once the -8% point has been taken out in the “Off High” column. For more volatile sector ETFs, the trigger point is -10%.
3. Trend Tracking Indexes (TTIs)
Our Trend Tracking Indexes (TTIs) headed higher as bullish momentum continued.
Here’s how we closed 11/04/2019:
Domestic TTI: +5.58% above its M/A (prior close +4.98%)—Buy signal effective 02/13/2019
International TTI: +3.76% above its M/A (prior close +2.94%)—Buy signal effective 10/29/2019
Disclosure: I am obliged to inform you that I, as well as my advisory clients, own some of the ETFs listed in the above table. Furthermore, they do not represent a specific investment recommendation for you, they merely show which ETFs from the universe I track are falling within the specified guidelines.
Contact Ulli