
- Moving the markets
After 1-1/2 years of trade negotiations, last Friday’s “mini-deal,” if you can even call it that, cast some more doubt on the substance of what was accomplished. The words “deal” or “substantial” just don’t fit the picture of what some analysts have called nothing more than a “farm package.”
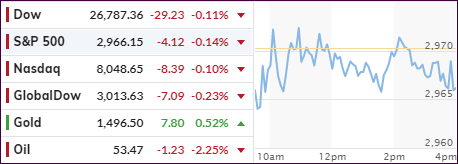
China has agreed to increase its purchases of US farm products up to $40 to $50 billion with no time limit attached, while the U.S. postponed planned increases in tariffs. That was the entire story upon which the computer algos went crazy and drove the Dow up over 300 points.
While today’s lackluster session was as much a function of the bond markets being closed for Columbus Day, a big contributor to the lack of buying was the general perception that the “phase 1” China deal will not improve trade barriers nor encourage economic growth any time soon.
Not helping matters was a report from Morgan Stanley calling last Friday’s close to be the high for stocks with selling now being on deck, as they see the trade truce to be disappointing and a boon for the bears.
However, markets could break in either direction, if you look at this updated chart from Bloomberg, which makes the case that, based on history, we could see a repeat of 1987 or 2013. If the perceived accuracy of this chart continues, we will find out the answer real soon.
2. ETFs in the Spotlight
In case you missed the announcement and description of this section, you can read it here again.
It features 10 broadly diversified and sector ETFs from my HighVolume list as posted every Saturday. Furthermore, they are screened for the lowest MaxDD% number meaning they have been showing better resistance to temporary sell offs than all others over the past year.
The below table simply demonstrates the magnitude with which some of the ETFs are fluctuating regarding their positions above or below their respective individual trend lines (%+/-M/A). A break below, represented by a negative number, shows weakness, while a break above, represented by a positive percentage, shows strength.
For hundreds of ETF choices, be sure to reference Thursday’s StatSheet.
For this current domestic “Buy” cycle, here’s how some our candidates have fared:
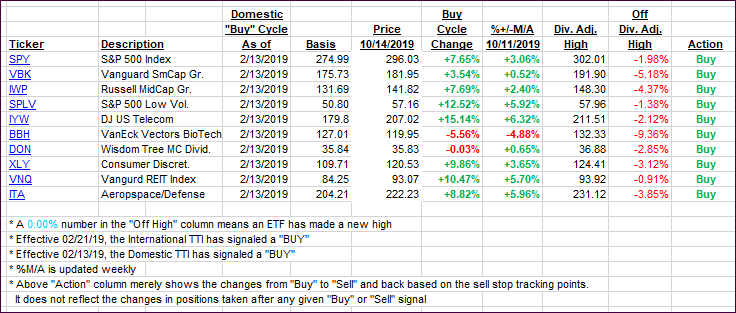
Again, the %+/-M/A column above shows the position of the various ETFs in relation to their respective long-term trend lines, while the trailing sell stops are being tracked in the “Off High” column. The “Action” column will signal a “Sell” once the -8% point has been taken out in the “Off High” column. For more volatile sector ETFs, the trigger point is -10%.
3. Trend Tracking Indexes (TTIs)
Our Trend Tracking Indexes (TTIs) slipped as a low volume Holiday, a closed bond market and questionable thought on the trade situation kept the indexes in a tight range.
Here’s how we closed 10/14/2019:
Domestic TTI: +2.10% above its M/A (prior close +2.31%)—Buy signal effective 02/13/2019
International TTI: +0.16% above its M/A (prior close +0.41%)—Sell signal effective 10/03/2019
Disclosure: I am obliged to inform you that I, as well as my advisory clients, own some of the ETFs listed in the above table. Furthermore, they do not represent a specific investment recommendation for you, they merely show which ETFs from the universe I track are falling within the specified guidelines.
Contact Ulli